
Bengang Steel Plates Co., Ltd.
The 3rd Quarterly Report 2010 (Full Text)
§1 Important Declaration
1.1 The Board of Directors and the directors of the Company guarantee that there are no significant omissions, fictitious or misleading statements carried in the Report and we will accept individual and joint responsibilities for the truthfulness, accuracy and completeness of the Report.
1.2 The 3rd Quarterly Report is not audited by CPA.
1.3 Chairman of the Board – Mr. Yu Tiancheng, Chief Financial Officer – Mr. Cao Aimin, and Head of Accounting Dept. – Mr. Zuo Zhanguo hereby declare: the authenticity and integrality of the report are guaranteed.
This report is prepared both in Chinese and English. When there is conflict understanding between the two versions, the Chinese version shall prevail.
§2 Company Profile
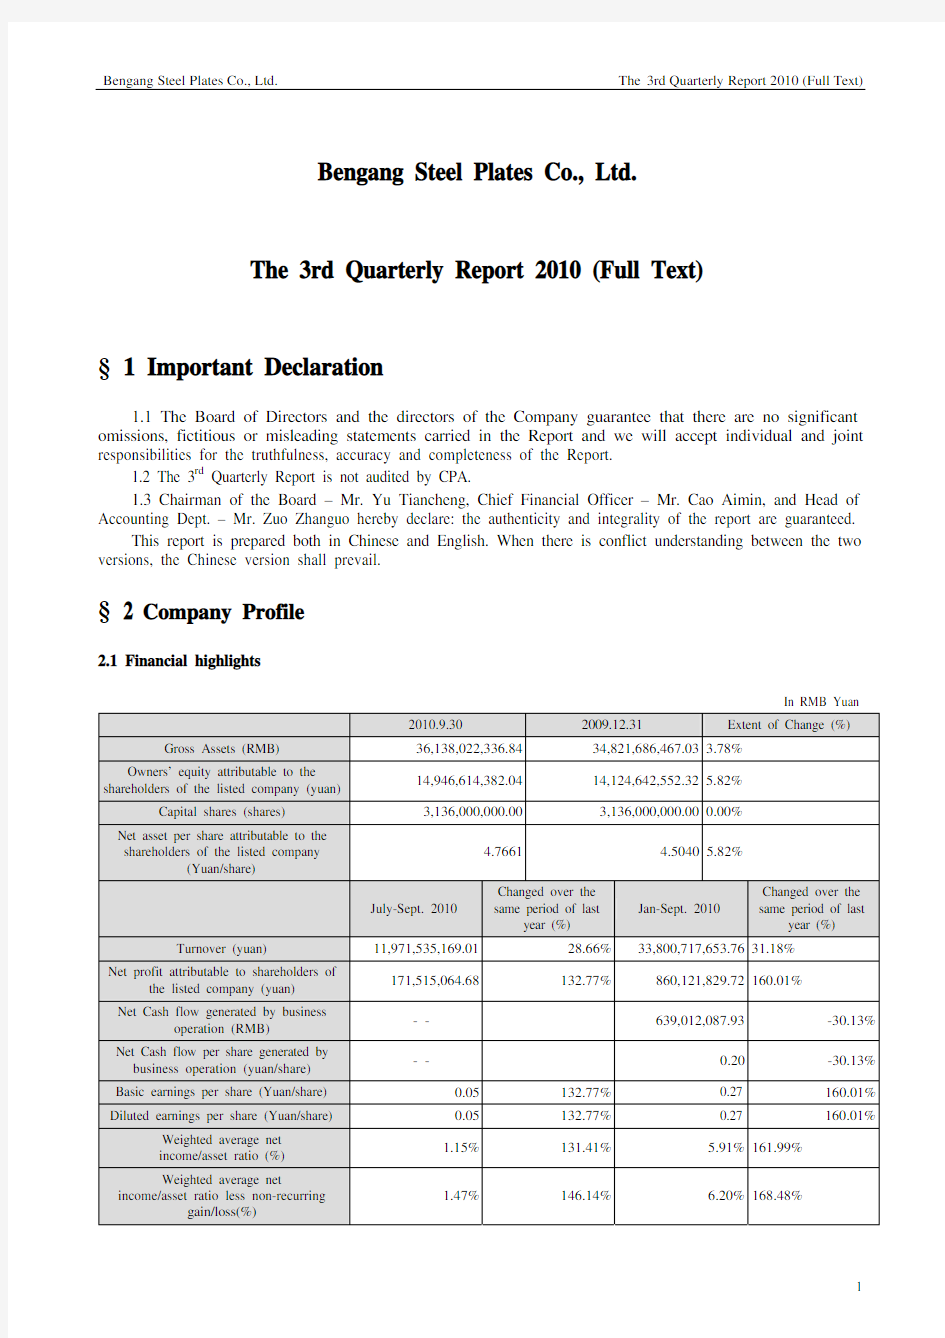
2.1 Financial highlights
In RMB Yuan
2010.9.30 2009.12.31 Extent of Change (%) Gross Assets (RMB) 36,138,022,336.8434,821,686,467.03 3.78% Owners’ equity attributable to the
shareholders of the listed company (yuan)
14,946,614,382.0414,124,642,552.32 5.82% Capital shares (shares) 3,136,000,000.003,136,000,000.00 0.00% Net asset per share attributable to the
shareholders of the listed company
(Yuan/share)
4.7661 4.5040
5.82%
July-Sept. 2010 Changed over the
same period of last
year (%)
Jan-Sept. 2010
Changed over the
same period of last
year (%)
Turnover (yuan) 11,971,535,169.0128.66%33,800,717,653.76 31.18% Net profit attributable to shareholders of
the listed company (yuan)
171,515,064.68132.77%860,121,829.72 160.01%
Net Cash flow generated by business
operation (RMB) - -
639,012,087.93
-30.13%
Net Cash flow per share generated by business operation (yuan/share) - - 0.20
-30.13%
Basic earnings per share (Yuan/share) 0.05132.77%0.27 160.01% Diluted earnings per share (Yuan/share) 0.05132.77%0.27 160.01% Weighted average net
income/asset ratio (%)
1.15%131.41% 5.91% 161.99%
Weighted average net
income/asset ratio less non-recurring
gain/loss(%)
1.47%146.14% 6.20% 168.48%
Non-recurring gain and loss items Amount from beginning of year to
the end of report term
Note
Gain/loss of non-current assets -58,279,946.98 Fixed asset discard in report term
Government subsidies accounted into current gain/loss account, other
than those closely related to the Company’s common business, comply
with the national policy and continues to enjoy at certain fixed rate or
amount.
388,540.02
Gain/loss from debt reorganization 6,769,133.24
Other non-business income and expenditures other than the above -5,403,138.35
Influenced amount of income tax 14,131,353.02
Total -42,394,059.05
- 2.2 Total of shareholders and the top 10 holders of unconditional shares
In Shares
Total shareholders at the end of the report period
(accounts)
66,565
Top ten holders of the shares without subscription limitation
Full name of shareholder Amount of unconditional shares held at
the end of report term
Categories
Benxi Steel (Group) Ltd. 536,800,000RMB common shares
DREYFUS PREMIER INVESTMENT FDS INC.-DREYFUS GREATER CHINA FD 52,237,245
Foreign shares placed in domestic
exchange
GOVERNMENT OF SINGAPORE INV. CORP.- A/C "C" 22,939,848
Foreign shares placed in domestic
exchange
NOMURA TST N BK CO.,LTD ATTF ASIA ATTR DIV STK FD MTH FD 18,049,086
Foreign shares placed in domestic
exchange
China Construction Bank – Shangtou Morgan
China Advantage Securities Investment Fund
15,689,356RMB common shares
GSIC A/C MONETARY AUTHORITY OF SINGAPORE 10,850,058
Foreign shares placed in domestic
exchange
RENAISSANCE CHINA PLUS FUND 7,760,556Foreign shares placed in domestic exchange
UBS AG LONDON BRANCH 6,640,442Foreign shares placed in domestic exchange
HTHK/BTDL-ASIAN MARKET LEADERS FUND 6,589,251
Foreign shares placed in domestic
exchange
CREDIT SUISSE (HONG KONG) LIMITED 5,829,634Foreign shares placed in domestic exchange
§3 Significant Events
3.1 Details and causations of major change in major accounting subjects and financial indices
√ applicable □ not applicable
* Main financial items in the consolidated financial statement which have changed for over 30% comparing with the financial situation at end of 2009
I. Balance Sheet Items Rate of change Cause of change
Monetary capital -37.56% Increasing of monetary capital paid by the Company Other account receivable 41.31% Increasing of other business payment receivable
Long-term share equity investment 210.92% Increasing of external share equity held by the Company Construction in process 87.31% Increasing construction in process
Engineering goods -82.29% Delivery of project materials
Notes payable -70.75% Due and disburse of notes payable
Tax payable -60.35% V AT payable increased this term
Other account payable 62.06% Increasing of payment clearance
Non-current liability due in 1 year -92.25% Clearing of non-current liabilities due in one year
Long-term borrowings 106.89% Increasing of bank loans
Special payable 1933.55% Receiving of special fund
Retained profit 57.55% Increasing of net profit
Minor shareholders’ equity Intake of extra shareholders by subsidiaries
* Main financial items in the consolidated statement which have changed for over 30% comparing with the financial performance of Jan-Sept 2009
II. Income Statement Items Rate of change Cause of change
Turnover 31.18% Increasing of sales and sales prices
Business tax and surcharge 1193.85% V AT payable increased this term
Sales expense 35.39% Increasing of export and therefore the port fee, freight, and tax Non-operational income -31.45% Decreasing of government subsidies
Non-operational expenditure -37.71% Discard of assets
Income tax expenses 232.34% Increasing of profit made by subsidiaries
Cash flow generated by business operation, net -30.13% Increasing of payment for purchasing
Net cash flow generated by financing 173.21% Increasing of bank loans
3.2 Progress of significant events, their influence, countermeasures, and analysis
3.2.1 None-standard opinions
□applicable √ not applicable
3.2.2 Illegal providing of capital or guarantees to the holding shareholder or its related parties or external parties
□applicable √ not applicable
3.2.3 Signing and execution of major business contracts
□applicable √ not applicable
3.2.4 Misc.
√ applicable □ not applicable
One entity was newly added to the consolidated report, which was:
According to the “External Investment Plan” adopted at the 1st meeting of the 5th term of Board held on June 3, 2010, the Company invested RMB65 million to establish Dalian Benruitong Automobile Material Technologies Co., Ltd. in Dalian City with Hubei Huitong Trade Group Co., Ltd. and Wuhu Ruichuang Investment Co., Ltd. The company has obtained the business license (大保工商企法字2102421101375)on July 1, 2010, with registered capital of RMB100 million. This investment has been verified by Dalian Zhaolin CPA Ltd. with the report 大兆会内验字(2010)第019号.
3.3 Fulfilling of commitment issues made by the Company, shareholder, or substantial controller √ applicable □ not applicable
Commitments
The
undertaker
Content of Commitments Status of fulfilling
Commitment in share equity relocation Benxi Steel
(Group)
Ltd.
1. After launching of the share relocation program, Bengang Group has
committed not to trade or transfer its shares in 24 months since the day
when they are allowed to trade in the stock exchange, and not more
than 5% of the total capital share of the Company between the 24th
month and the 36th month. 2. Bengang Group committed not to put
the newly placed shares in the market or sell to others in 36 months
since the date when the share registration is done. (except for
transferring to strategic investors that is approved by the national
policy, the commitments shall be carried forward by the underwriter.) 3.
From completion of handover till the end of 2010, Bengang Group
shall hold not less than 65% of the Company’s capital shares. (But
except for transferring to strategic investors under the permission of
national policies, with the condition of the new holder shall keep the
commitment made forth by Bengang Group.) 4. When the Group is
trading or transferring the shares it holds in the Company before the
end of 2010, the prices shall not lower than the net asset per share
provided by the latest auditing report. Bengang Group committed that
the proceeds from trading of the shares, by breaching of faith as said
above, will be transferred to the possession of the Company. 5.
Bengang Group promises to be responsible for the losses due to its
failure or partially failure in fulfilling of the above responsibilities.
The commitments are
under processing at
present and no
breaching of
commitment has
occurred.
Commitment made
in acquisition report
or equity alternation
report
None None None
Commitment made
in major asset
restructuring
None None None
Commitment made at
issuing
None None None
Other commitments
(including
supplementary
commitments)
None None None
3.4 Estimated accumulative profit from the year beginning to the end of the next report period may be of deficits; or in comparison with the same period of the previous year, give the warning of great change and the notice to the reasons.
□applicable √ not applicable
3.5 Major events needs to be explained
3.5.1 Investment in securities
□applicable √ not applicable
3.5.2 Reception of investigations, communications, or interviews
Time/date Place Way Visitors Main content involved and material provided July 13, 2010 Office of the secretary of Board Field research North-east Security Production and operation situation
3.6 Investment in derivate financial instruments
□applicable √ not applicable
3.6.1 Derivate financial instrument stock at end of report term
□applicable √ not applicable
§4 Attachments
4.1 Balance Sheet
Prepared by Bengang Steel Plates Co., Ltd. Ended September 30, 2010 RMB Yuan
Balance at the end of term Balance at the beginning of year Items
Consolidated Parent company Consolidated Parent company Current asset:
Monetary capital 1,775,213,052.981,460,454,024.162,842,961,050.60 2,795,043,926.41 Settlement provision
Outgoing call loan
Transactional financial assets
Notes receivable 2,266,847,918.032,139,262,535.401,758,593,662.55 1,692,464,732.45 Account receivable 524,413,747.51683,359,988.55578,413,768.04 736,508,549.83 Prepayment 970,071,480.91970,071,480.911,150,044,136.73 1,134,073,791.54 Insurance receivable
Reinsurance receivable
Provisions of Reinsurance contracts receivable
Interest receivable
Dividend receivable
Other account receivable 132,304,970.07233,580,451.5393,630,458.88 210,275,779.87 Repurchasing of financial assets
Inventories 10,044,572,795.669,553,292,449.898,075,674,235.63 7,701,138,465.80 Non-current asset due in 1 year
Other current asset 182,211,823.73182,211,823.73182,211,823.73 182,211,823.73 Total of current asset 15,895,635,788.8915,222,232,754.1714,681,529,136.16 14,451,717,069.63 Non-current assets
Loans and payment on other’s behalf disbursed
Disposable financial asset
Expired investment in possess
Long-term receivable
Long-term share equity investment 5,732,780.00868,597,157.171,843,800.00 539,708,177.17 Investment properties
Fixed assets 16,579,835,576.1116,158,160,792.0817,962,489,063.75 17,518,704,793.06 Construction in process 3,420,708,688.262,772,775,245.421,826,180,938.13 1,826,180,938.13 Engineering goods 24,435,746.7024,435,746.70137,969,772.11 137,969,772.11 Fixed asset disposal
Production physical assets
Gas & petrol
Intangible assets
R&D expense
Goodwill
expenses
Long-term amortizable
Differed income tax asset 211,673,756.88210,573,821.71211,673,756.88 210,573,821.71 Other non-current asset
Total of non-current assets 20,242,386,547.9520,034,542,763.0820,140,157,330.87 20,233,137,502.18 Total of assets 36,138,022,336.8435,256,775,517.2534,821,686,467.03 34,684,854,571.81 Current liabilities
Short-term loans 2,308,316,000.002,308,316,000.002,845,850,700.00 2,845,850,700.00
Loan from Central Bank
Deposit received and hold for others
Call loan received
Trade off financial liabilities
Notes payable 1,239,664,801.861,239,664,801.864,238,076,393.71 4,238,076,393.71 Account payable 6,978,644,704.937,172,262,258.246,261,007,678.94 6,401,502,740.43 Prepayment received 2,978,554,490.492,589,139,501.862,538,565,736.60 2,418,365,310.33 Selling of repurchased financial assets
Fees and commissions receivable
Employees’ wage payable 193,864,036.15193,864,036.15245,128,249.09 245,128,249.09 Tax payable -46,491,008.14-42,817,752.55-117,251,269.73 -99,007,033.77 Interest payable
Dividend payable
Other account payable 1,377,272,050.441,453,904,421.21849,874,951.99 747,373,431.76 Reinsurance fee payable
Insurance contract provision
Entrusted trading of securities
Entrusted selling of securities
Non-current liability due in 1 year 74,423,563.6074,423,563.60960,040,053.18 960,040,053.18 Other current liability
Total of current liability 15,104,248,639.3314,988,756,830.3717,821,292,493.78 17,757,329,844.73 Non-current liabilities
Long-term borrowings 5,935,875,998.805,425,875,998.802,869,036,104.26 2,869,036,104.26 Bond payable
Long-term payable
Special payable 115,234,666.67115,234,666.675,666,666.67 5,666,666.67 Contingent liabilities
Differed income tax liability
Other non-recurring liabilities 1,048,650.001,048,650.001,048,650.00 1,048,650.00 Total of non-current liabilities 6,052,159,315.475,542,159,315.472,875,751,420.93 2,875,751,420.93 Total of liability 21,156,407,954.8020,530,916,145.8420,697,043,914.71 20,633,081,265.66 Owners’ equity (or shareholders’ equity)
Capital paid in (or share capital) 3,136,000,000.003,136,000,000.003,136,000,000.00 3,136,000,000.00 Capital reserves 8,792,191,134.768,792,191,134.768,736,261,134.76 8,736,261,134.76 Less: Shares in stock
Special reserves
Surplus reserves 921,277,509.22921,277,509.22921,277,509.22 921,277,509.22 Common risk provision
Retained profit 2,097,145,738.061,876,390,727.431,331,103,908.34 1,258,234,662.17 Different of foreign currency translation
Total of owner’s equity belong to the parent company14,946,614,382.0414,725,859,371.4114,124,642,552.32 14,051,773,306.15 Minor shareholders’ equity 35,000,000.00
Total of owners’ equity 14,981,614,382.0414,725,859,371.4114,124,642,552.32 14,051,773,306.15 Total of liabilities and owners’ equity 36,138,022,336.8435,256,775,517.2534,821,686,467.03 34,684,854,571.81
4.2 Income Statement of the report term
Prepared by: Bengang Steel Plates Co., Ltd. July-Sept 2010 RMB Yuan
Amount of the Current Term Amount of the Previous Term
Items
Consolidated Parent company Consolidated Parent company
I. Total revenue 11,971,535,169.0111,741,327,075.539,304,927,031.04 9,115,252,601.04
Incl. Business income 11,971,535,169.0111,741,327,075.539,304,927,031.04 9,115,252,601.04 Interest income
Insurance fee earned
Fee and commission received
II. Total business cost 11,692,345,649.2311,651,311,790.229,733,441,079.84 9,563,071,709.00
Incl. Business cost 10,625,735,529.7610,623,979,573.749,020,608,173.52 8,900,300,926.37 Interest expense
Fee and commission paid
Insurance discharge payment
Net claim amount paid
Net insurance policy reserves provided
Insurance policy dividend paid
Reinsurance expenses
Business tax and surcharge 70,979,357.4266,261,105.881,389,284.02 887,833.03
Sales expense 122,504,653.6299,498,055.7554,840,434.66 30,439,099.92
Administrative expense 864,128,685.63852,464,403.99615,894,619.47 611,247,338.93
Financial expenses 8,997,422.809,108,650.8620,063,913.55 20,196,510.75
Asset impairment loss 20,644,654.62
Plus: Gains from change of fair value (“-“ for loss)
Investment gain (“-“ for loss)
Incl. Investment gains from affiliates
Gains from currency exchange (“-“ for loss)
III. Operational profit (“-“ for loss) 279,189,519.7890,015,285.31-428,514,048.80 -447,819,107.96
Plus: Non business income -3,746,255.80-3,817,302.823,830,210.56 2,690,210.56
Less: Non-business expenses 59,463,844.0659,463,849.9195,351,983.35 95,334,362.17 Incl. Loss from disposal of non-current assets -59,002,245.28-59,002,245.28-95,319,892.90 -95,319,892.90
IV. Gross profit (“-“ for loss) 215,979,419.9226,734,132.58-520,035,821.59 -540,463,259.57
Less: Income tax expenses 44,464,355.243,320,669.20
V. Net profit (“-“for net loss) 171,515,064.6826,734,132.58-523,356,490.79 -540,463,259.57
Net profit attributable to the owners of parent
171,515,064.6826,734,132.58-523,356,490.79 -540,463,259.57
company
Minor shareholders’ equity
VI. Earnings per share:
-0.1723
(I) Basic earnings per share 0.050.01-0.1669
(II) Diluted earnings per share 0.050.01-0.1669 -0.1723
0.00
VII. Other misc. incomes 0.000.000.00 VIII. Total of misc. incomes 171,515,064.6826,734,132.58-523,356,490.79 -540,463,259.57
Total of misc. incomes attributable to the owners of
171,515,064.6826,734,132.58-523,356,490.79 -540,463,259.57
the parent company
Total misc gains attributable to the minor
shareholders
4.3 Income Statement from the beginning of year to the end of report term
Prepared by: Bengang Steel Plates Co., Ltd. Jan-Sept 2010 RMB Yuan
Amount of the Current Term Amount of the Previous Term
Items
Consolidated Parent company Consolidated Parent company
I. Total revenue 33,800,717,653.7632,830,199,135.9025,766,554,848.82 25,130,011,586.72
Incl. Business income 33,800,717,653.7632,830,199,135.9025,766,554,848.82 25,130,011,586.72 Interest income
Insurance fee earned
Fee and commission received
II. Total business cost 32,834,719,558.0532,061,152,887.4827,093,768,462.69 26,535,020,059.65
Incl. Business cost 29,739,981,552.6729,068,505,742.0924,606,082,401.34 24,117,956,233.12 Interest expense
Fee and commission paid
Insurance discharge payment
Net claim amount paid
Net insurance policy reserves provided
Insurance policy dividend paid
Reinsurance expenses
Business tax and surcharge 159,854,603.94154,081,011.7912,354,982.20 10,993,392.89
Sales expense 354,972,728.41288,953,696.79183,144,183.18 125,378,898.05
Administrative expense 2,452,986,066.602,422,381,476.912,159,699,456.69 2,147,901,689.12
Financial expenses 126,924,606.43127,230,959.90132,487,439.28 132,789,846.47
Asset impairment loss
Plus: Gains from change of fair value (“-“ for loss)
Investment gain (“-“ for loss)
Incl. Investment gains from affiliates
Gains from currency exchange (“-“ for loss)
III. Operational profit (“-“ for loss) 965,998,095.71769,046,248.42-1,327,213,613.87 -1,405,008,472.93
Plus: Non business income 2,948,756.622,653,666.754,301,840.21 1,783,476.69
Less: Non-business expenses 59,474,168.6959,463,849.9195,481,389.59 95,450,018.41 Incl. Loss from disposal of non-current assets -58,279,946.98-58,279,946.98-95,315,772.90 -95,315,772.90
IV. Gross profit (“-“ for loss) 909,472,683.64712,236,065.26-1,418,393,163.25 -1,498,675,014.65
Less: Income tax expenses 49,350,853.9214,849,727.93
V. Net profit (“-“for net loss) 860,121,829.72712,236,065.26-1,433,242,891.18 -1,498,675,014.65
Net profit attributable to the owners of parent
860,121,829.72712,236,065.26-1,433,242,891.18 -1,498,675,014.65
company
Minor shareholders’ equity
VI. Earnings per share:
-0.4779
(I) Basic earnings per share 0.270.23-0.4570
(II) Diluted earnings per share 0.270.23-0.4570 -0.4779
0.00
VII. Other misc. incomes 0.000.000.00 VIII. Total of misc. incomes 860,121,829.72712,236,065.26-1,433,242,891.18 -1,498,675,014.65
Total of misc. incomes attributable to the owners
860,121,829.72712,236,065.26-1,433,242,891.18 -1,498,675,014.65
of the parent company
Total misc gains attributable to the minor
shareholders
4.4 Cash Flow Statement from the beginning of year to the end of report term.
Prepared by: Bengang Steel Plates Co., Ltd. Jan-Sept 2010 RMB Yuan
Amount of the Current Term Amount of the Previous Term Items
Consolidated Parent company Consolidated Parent company
I. Net cash flow from business operation
Cash received from sales of products and
23,340,939,393.1423,356,842,088.6221,066,349,988.45 20,987,557,927.19 providing of services
Net increase of customer deposits and capital kept
for brother company
Net increase of loans from central bank
Net increase of inter-bank loans from other
financial bodies
Cash received against original insurance contract
Net cash received from reinsurance business
Net increase of client deposit and investment
Net increase of trade financial asset disposal
Cash received as interest, processing fee, and
commission
Net increase of inter-bank fund received
Net increase of repurchasing business
Tax returned 83,943,893.8180,970,050.3550,000.00
Other cash received from business operation 23,724,955.0722,197,790.0818,623,195.60 17,263,780.53
Sub-total of cash inflow from business
23,448,608,242.0223,460,009,929.0521,085,023,184.05 21,004,821,707.72 activities
Cash paid for purchasing of merchandise and
20,034,016,709.4920,261,016,709.4918,812,740,908.99 18,782,740,908.99 services
Net increase of client trade and advance
Net increase of savings in central bank and
brother company
Cash paid for original contract claim
Cash paid for interest, processing fee and
commission
Cash paid for policy dividend
Cash paid to staffs or paid for staffs 1,426,716,893.201,419,455,642.79812,551,693.30 808,505,147.30
Taxes paid 1,083,263,361.311,016,641,513.00338,433,022.62 321,407,909.19
Other cash paid for business activities 265,599,190.09245,265,858.79206,665,836.69 199,514,150.68
Sub-total of cash outflow from business
22,809,596,154.0922,942,379,724.0720,170,391,461.60 20,112,168,116.16 activities
Cash flow generated by business operation,
639,012,087.93517,630,204.98914,631,722.45 892,653,591.56 net
II. Cash flow generated by investing
Cash received from investment retrieving
Cash received as investment gains
Net cash retrieved from disposal of fixed assets,
165,718.00165,568.00
intangible assets, and other long-term assets
Net cash received from disposal of subsidiaries or
other operational units
Other investment-related cash received
Sub-total of cash inflow due to investment
165,718.00165,568.00
activities
Cash paid for construction of fixed assets,
3,079,328,050.712,454,787,922.392,682,939,004.87 2,682,939,004.87 intangible assets and other long-term assets
Cash paid as investment 68,888,980.00328,888,980.00
Net increase of loan against pledge
Net cash received from subsidiaries and other
operational units
Other cash paid for investment activities
Sub-total of cash outflow due to investment
3,148,217,030.712,783,676,902.392,682,939,004.87 2,682,939,004.87 activities
Net cash flow generated by investment -3,148,051,312.71-2,783,511,334.39-2,682,939,004.87 -2,682,939,004.87
III. Cash flow generated by financing
Cash received as investment
Incl. Cash received as investment from minor
shareholders
Cash received as loans 6,162,898,612.315,652,898,612.315,090,533,139.93 5,090,533,139.93
Cash received from bond placing
Other financing-related cash received
Subtotal of cash inflow from financing
6,162,898,612.315,652,898,612.315,090,533,139.93 5,090,533,139.93 activities
Cash to repay debts 4,462,000,204.314,462,000,204.314,246,865,259.20 4,246,865,259.20
Cash paid as dividend, profit, or interests 259,569,568.21259,569,568.21316,119,789.54 316,119,789.54
Incl. Dividend and profit paid by subsidiaries to
minor shareholders
Other cash paid for financing activities
Subtotal of cash outflow due to financing
4,721,569,772.524,721,569,772.524,562,985,048.74 4,562,985,048.74 activities
Net cash flow generated by financing 1,441,328,839.79931,328,839.79527,548,091.19 527,548,091.19
IV. Influence of exchange rate alternation on cash and
-37,612.63-37,612.63-157,918.71 -157,918.71 cash equivalents
V. Net increase of cash and cash equivalents -1,067,747,997.62-1,334,589,902.25-1,240,917,109.94 -1,262,895,240.83
Plus: Balance of cash and cash equivalents at the
2,842,961,050.602,795,043,926.412,220,835,995.51 2,209,824,428.24 beginning of term
VI. Balance of cash and cash equivalents at the end of
1,775,213,052.981,460,454,024.16979,918,885.57 946,929,187.41 term
4.5 Auditors’ Report
Auditor’s opinion: not audited.
钢板理论重量表(钢板的理论重量) 厚度理论重量 理论重量厚度理论重量 厚度(mm) (mm)(kg/m2)(kg/m2)(mm)(kg/m2) 0.2 1.57 0.75 5.89 1.8 14.13 0.25 1.96 0.8 6.28 2 15.7 0.3 2.36 0.9 7.07 2.2 17.27 0.35 2.75 1 7.85 2.5 19.36 0.4 3.14 1.1 8.64 2.8 21.98 0.45 3.53 1.2 9.42 3 23.55 0.5 3.93 1.3 10.21 3.2 25.12 0.55 4.32 1.4 10.99 3.5 27.48 0.6 4.71 1.5 11.78 3.8 29.83 0.65 5.1 1.6 12.56 3.9 30.62 0.7 5.5 1.7 13.35 4 31.4 中厚钢板理论重量表(中厚钢板钢板的理论重量) 厚度理论重量厚度理论重量厚度理论重量(mm)(kg/m2)(mm)(kg/m2)(mm)(kg/m2) 4.5 3 5.33 16 125.6 38 298.3 5 39.25 18 141.3 40 314 5.5 43.18 20 157 42 329.7 6 47.16 22 172. 7 44 345.4
7 54.95 24 188.4 45 353.25 8 62.8 25 196.25 46 361.1 9 70.65 26 204.1 48 376.8 10 78.6 28 219.8 50 392.5 11 86.35 30 235.5 52 408.2 12 94.2 32 251.2 54 423.9 13 102.1 34 266.9 55 431.75 14 109.9 35 274.75 56 439.6 15 117.75 36 282.6 58 455.3 计算方法 结果修约 基本重量kg/mm.m2 7.85(厚度1mm,面积1m2的重量 — 单位重量kg/m2 基本重量(kg/m2)*厚度(mm) 修约至四位有效数字 钢板面积m2 宽度(m)*长度(m) 修约至四位有效数字 1块板重量kg
钢板理论重量表(钢板的理论重量) 厚度理论重量 理论重量厚度理论重量 厚度(mm) (mm) (kg/m2) (kg/m2) (mm) (kg/m2) 0、2 1、57 0、75 5、89 1、8 14、13 0、25 1、96 0、8 6、28 2 15、7 0、3 2、36 0、9 7、07 2、2 17、27 0、35 2、75 1 7、85 2、5 19、36 0、4 3、14 1、1 8、64 2、8 21、98 0、45 3、53 1、2 9、42 3 23、55 0、5 3、93 1、3 10、21 3、2 25、12 0、55 4、32 1、4 10、99 3、5 27、48 0、6 4、71 1、5 11、78 3、8 29、83 0、65 5、1 1、6 12、56 3、9 30、62 0、7 5、5 1、7 13、35 4 31、4 中厚钢板理论重量表(中厚钢板钢板的理论重量) 厚度理论重量厚度理论重量厚度理论重量(mm) (kg/m2) (mm) (kg/m2) (mm) (kg/m2) 4、5 3 5、33 16 125、6 38 298、3 5 39、25 18 141、3 40 314 5、5 43、18 20 157 42 329、7 6 47、16 22 172、 7 44 345、4
7 54、95 24 188、4 45 353、25 8 62、8 25 196、25 46 361、1 9 70、65 26 204、1 48 376、8 10 78、6 28 219、8 50 392、5 11 86、35 30 235、5 52 408、2 12 94、2 32 251、2 54 423、9 13 102、1 34 266、9 55 431、75 14 109、9 35 274、75 56 439、6 15 117、75 36 282、6 58 455、3 计算方法 结果修约 基本重量kg/mm、m2 7、85(厚度1mm,面积1m2的重量 — 单位重量kg/m2 基本重量(kg/m2)*厚度(mm) 修约至四位有效数字 钢板面积m2 宽度(m)*长度(m) 修约至四位有效数字 1块板重量kg
厚度Q235B06Cr19Ni10022Cr19Ni1006Cr17Ni12Mo2022Cr17Ni12Mo2δ=4mm31.431.7231.63232 δ=5mm39.2539.6539.54040 δ=6mm47.147.5847.44848 δ=8mm62.863.4463.26464 δ=10mm78.579.3798080 δ=12mm94.295.1694.89696 δ=14mm109.9111.02110.6112112 δ=16mm125.6126.88126.4128128 δ=18mm141.3142.74142.2144144 δ=20mm157158.6158160160 δ=22mm172.7174.46173.8176176 δ=24mm188.4190.32189.6192192 δ=26mm204.1206.18205.4208208 δ=28mm219.8222.04221.2224224 δ=30mm235.5237.09237240240 δ=32mm251.2253.76252.8256256 δ=34mm266.9269.62268.6272272 δ=36mm282.6285.48284.4288288
厚度Q235B06Cr19Ni10022Cr19Ni1006Cr17Ni12Mo2022Cr17Ni12Mo2δ=38mm298.3301.34300.2304304 δ=40mm314317.2316320320 δ=42mm329.7333.06331.8336336 δ=44mm345.6348.92347.6352352 δ=46mm361.1364.78363.4368368 δ=48mm376.8380.64379.2384384 δ=50mm392.5396.5395400400 δ=52mm408.2412.36410.8416416 δ=54mm423.9428.22426.6432432 δ=56mm439.6444.08442.4448448 δ=58mm455.3459.94458.2464464 δ=60mm471475.8474480480 备注:①Q235B密度7.85×10³kg/m3,06Cr19Ni10密度7.93×103kg/m3,022Cr19Ni10密度7.9×103kg/m3,06Cr17Ni12Mo2和022Cr17Ni12Mo2密度8.0×103kg/m3计算;②06Cr19Ni10对应旧牌号Cr18Ni9美标304;022Cr19Ni10对应旧牌号Cr19Ni10美标304L;06Cr17Ni12Mo2对应旧牌号0Cr17Ni12Mo2;美标316;022Cr17Ni12Mo2对应旧牌号。0Cr17Ni14Mo2美标316L
计算方法结果修约 基本重量kg/mm.m2 7.85(厚度1mm,面积1m2的重量单位重量kg/m2 基本重量(kg/m2)*厚度(mm) 修约至四位有效数字 钢板面积m2 宽度(m)*长度(m) 修约至四位有效数字 1块板重量kg
单位重量(kg/m2)*钢板面积(m2) 修约至三位有效数字 1捆重量kg 1块板重量(kg)*同规格的1捆钢板块数修约至kg的整数位S 总重量kg
钢板重量计算公式: 钢管重量(公斤)=0.00617×直径×直径×长度 方钢重量(公斤)=0.00785×边宽×边宽×长度 六角钢重量(公斤)=0.0068×对边宽×对边宽×长度 八角钢重量(公斤)=0.0065×对边宽×对边宽×长度 螺纹钢重量(公斤)=0.00617×计算直径×计算直径×长度 角钢重量(公斤)=0.00785×(边宽+边宽-边厚)×边厚×长度扁钢重量(公斤)=0.00785×厚度×边宽×长度 钢管重量(公斤)=0.02466×壁厚×(外径-壁厚)×长度 钢板重量(公斤)=7.85×厚度×面积 园紫铜棒重量(公斤)=0.00698×直径×直径×长度 园黄铜棒重量(公斤)=0.00668×直径×直径×长度 园铝棒重量(公斤)=0.0022×直径×直径×长度 方紫铜棒重量(公斤)=0.0089×边宽×边宽×长度 方黄铜棒重量(公斤)=0.0085×边宽×边宽×长度 方铝棒重量(公斤)=0.0028×边宽1×边宽×长度 六角紫铜棒重量(公斤)=0.0077×对边宽×对边宽×长度 六角黄铜棒重量(公斤)=0.00736×边宽×对边宽×长度 六角铝棒重量(公斤)=0.00242×对边宽×对边宽×长度 紫铜板重量(公斤)=0.0089×厚×宽×长度 黄铜板重量(公斤)=0.0085×厚×宽×长度 铝板重量(公斤)=0.00171×厚×宽×长度 园紫铜管重量(公斤)=0.028×壁厚×(外径-壁厚)×长度
钢板理论重量表,中厚钢板理论重量表, 金属理论重量计算方法 钢板理论重量表,中厚钢板理论重量表,金属理论重量计算方法 理论重量计算方法 角钢:每米重量=* (边宽+边宽-边厚)*边厚 圆钢:每米重量=*直径*直径(螺纹钢和圆钢相同) 扁钢:每米重量=*厚度*边宽 管材:每米重量=*壁厚* (外径-壁厚) 板材:每米重量=*厚度 黄铜管:每米重量=*壁厚* (外径-壁厚) 紫铜管:每米重量=*壁厚* (外径-壁厚) 铝花纹板:每平方米重量=*厚度 有色金属比重:紫铜板黄铜板锌板铅板 有色金属板材的计算公式为:每平方米重量=比重*厚度理论重量计算方法 角钢:每米重量=* (边宽+边宽-边厚)*边厚 圆钢:每米重量=*直径*直径(螺纹钢和圆钢相同) 扁钢:每米重量=*厚度*边宽 管材:每米重量=*壁厚* (外径-壁厚) 板材:每米重量=*厚度 黄铜管:每米重量=*壁厚* (外径-壁厚)
紫铜管:每米重量=*壁厚* (外径-壁厚)
铝花纹板:每平方米重量=*厚度 有色金属比重:紫铜板黄铜板锌板铅板 有色金属板材的计算公式为:每平方米重量=比重*厚度 理论重量计算方法角钢圆钢扁钢管材板材黄铜管紫铜管铝花纹板 钢板理论重量表(钢板的理论重量)
中厚钢板理论重量表(中厚钢板钢板的理论重量) 矩形方管理论重量计算表,方管理论重量,镀锌方管理论重量,方管的理论重量,计球墨铸铁管价格算公式: 4x壁厚(bihou)x(边南京球墨铸铁管长-壁厚(bihou)) 其中,边长和壁厚都以毫米为单位,直接把数值代入上述公式,得岀即为上海球墨铸铁管每米方管的重量, 以克为单 位。 如毫米的方管,按上述公式即可算岀其每米重量为: ==2158.75克,即约公斤 当壁厚和边长都以毫米为单位时,4x壁厚x(边长-壁厚)算岀的是每米长度方管的体积,以立方厘米为单位,
钢板理论重量表,中厚钢板理论重量表,金属理论重量计算方法 钢板理论重量表,中厚钢板理论重量表,金属理论重量计算方法 理论重量计算方法 角钢:每米重量=0.00785*(边宽+边宽-边厚)*边厚 圆钢:每米重量=0.00617*直径*直径(螺纹钢和圆钢相同) 扁钢:每米重量=0.00785*厚度*边宽 管材:每米重量=0.02466*壁厚*(外径-壁厚) 板材:每米重量=7.85*厚度 黄铜管:每米重量=0.02670*壁厚*(外径-壁厚) 紫铜管:每米重量=0.02796*壁厚*(外径-壁厚) 铝花纹板:每平方米重量=2.96*厚度 有色金属比重:紫铜板8.9黄铜板8.5锌板7.2铅板11.37 有色金属板材的计算公式为:每平方米重量=比重*厚度理论重量计算方法 角钢:每米重量=0.00785*(边宽+边宽-边厚)*边厚 圆钢:每米重量=0.00617*直径*直径(螺纹钢和圆钢相同) 扁钢:每米重量=0.00785*厚度*边宽 管材:每米重量=0.02466*壁厚*(外径-壁厚) 板材:每米重量=7.85*厚度 黄铜管:每米重量=0.02670*壁厚*(外径-壁厚) 紫铜管:每米重量=0.02796*壁厚*(外径-壁厚)
铝花纹板:每平方米重量=2.96*厚度 有色金属比重:紫铜板8.9黄铜板8.5锌板7.2铅板11.37 有色金属板材的计算公式为:每平方米重量=比重*厚度 理论重量计算方法角钢圆钢扁钢管材板材黄铜管紫铜管铝花纹板
矩形方管理论重量计算表,方管理论重量,镀锌方管理论重量,方管的理论重量,计球墨铸铁管价格算公式:4x壁厚(bihou)x(边南京球墨铸铁管长-壁厚(bihou))x7.85 其中,边长和壁厚都以毫米为单位,直接把数值代入上述公式,得出即为上海球墨铸铁管每米方管的重量, 以克为单位。 如30x30x2.5毫米的方管,按上述公式即可算出其每米重量为: 4x2.5x(30-2.5)x7.85=275x7.85=2158.75克,即约2.16公斤 当壁厚和边长都以毫米为单位时,4x壁厚x(边长-壁厚)算出的是每米长度方管的体积,以立方厘米为单
花纹钢板每平方米重量表 热轧圆钢每米重量表 基本厚度 (毫米) 纹高(毫米)理论重量(公斤/ 米 2 ) 菱形花纹钢板扁豆形花纹钢板菱形花纹钢板扁豆形花纹钢板 钢结构 2.5 1.0 2.521.6022.60 设计简单步骤 思路 3.0 1.0 2.525.6026.60 和设计 3.5 1.0 2.529.5030.50 4.0 1.0 2.533.4034.40 4.5 1.0 2.537.3038.30 5.0 1.5 2.542.3042.30 5.5 1.5 2.54 6.2046.20 6.0 1.5 2.550.1050.10 7.0 2.0 2.559.0058.00 8.0 2.0 2.566.8065.80
2008/06/20,16:11 运算。同时,它也是判断计算机内力分析输出数据可靠和否的主要依 据。 林同炎教授在《结构概念和体系》一书中介绍了用整体概念来规划结构方案的方法,以及结构总体系和个分体系间的相互力学关系和简化近 似设计方 法。
钢结构通常有框架、平面桁架、网架(壳)、索膜、轻钢、塔桅等结构形式。 其理论和技术大都成熟。亦有部分难题没有解决,或没有简单实用的设计方法,比如网壳的稳定等。 结构选型时,应考虑不同结构形式的特点。在工业厂房中,当有较大悬挂荷载或大范围移动荷载,就可考虑放弃门式刚架而采用网架。基本雪压大的地区,屋面曲线应有利于积雪滑落(切线50 度外不需考虑雪载),如亚东水泥厂石灰石仓棚采用三心圆网壳,总雪载和坡屋面相比释放近一半。降雨量大的地区相似考虑。建筑允许时,在框架中布置支撑会比简单的节点刚接的框架有更好的经济性。而屋面覆盖跨度较大的建筑中,可选择构件受拉为主的悬索或索膜结构体系。高层钢结构设计中,常采用钢混凝土组合结构,在地震烈度高或很不规则的高层中,不应单纯为了经济去选择不利抗震的核心筒加外框的形式。宜选择周边巨型SRC 柱,核心为支撑框架的结构体系。我国半数以上的此类高层为前者,对抗震不利。 结构的布置要根据体系特征,荷载分布情况及性质等综合考虑.一般的说要刚度均匀.力学模型清晰. 尽可能限制大荷载或移动荷载的影响范围,使其以最直接的线路传递到基础. 柱间抗侧支撑的分布应均匀.其形心要尽量靠近侧向力(风、震)的作用线. 否则应考虑结构的扭转. 结构的抗侧应有多道防线. 比如有支撑框架结构,柱子至少应能单独承受1/4 的总水平力. 框架结构的楼层平面次梁的布置,有时可以调整其荷载传递方向以满足不同的要求。通常为了减小截面沿短向布置次梁,但是这会使主梁截面加大,减少了楼层净高,顶层边柱也有时会吃不消,此时把次梁支撑在较短的主梁上可以牺牲次梁保住主梁和柱子. (三)预估截面
. 钢板理论重量表(钢板的理论重量) 理论重量厚度理论重量厚度理论重量 厚度(mm) (mm)(kg/m2)(kg/m2)(mm)(kg/m2) 0.2 1.57 0.75 5.89 1.8 14.13 0.25 1.96 0.8 6.28 2 15.7 0.3 2.36 0.9 7.07 2.2 17.27 0.35 2.75 1 7.85 2.5 19.36 0.4 3.14 1.1 8.64 2.8 21.98 0.45 3.53 1.2 9.42 3 23.55 0.5 3.93 1.3 10.21 3.2 25.12 0.55 4.32 1.4 10.99 3.5 27.48 0.6 4.71 1.5 11.78 3.8 29.83 0.65 5.1 1.6 12.56 3.9 30.62 0.7 5.5 1.7 13.35 4 31.4 中厚钢板理论重量表(中厚钢板钢板的理论重量) 厚度理论重量厚度理论重量厚度理论重量(mm)(kg/m2)(mm)(kg/m2)(mm)(kg/m2) 4.5 3 5.33 16 125.6 38 298.3 5 39.25 18 141.3 40 314 5.5 43.18 20 157 42 329.7 6 47.16 22 172. 7 44 345.4
. 7 54.95 24 188.4 45 353.25 8 62.8 25 196.25 46 361.1 9 70.65 26 204.1 48 376.8 10 78.6 28 219.8 50 392.5 11 86.35 30 235.5 52 408.2 12 94.2 32 251.2 54 423.9 13 102.1 34 266.9 55 431.75 14 109.9 35 274.75 56 439.6 15 117.75 36 282.6 58 455.3 计算方法 结果修约 基本重量kg/mm.m2 7.85(厚度1mm,面积1m2的重量 — 单位重量kg/m2 基本重量(kg/m2)*厚度(mm) 修约至四位有效数字 钢板面积m2 宽度(m)*长度(m) 修约至四位有效数字 1块板重量kg
薄钢板 厚度(mm)理论重量 2 (kg/m) 厚度(mm) 理论重量 (kg/m2) 2) 厚度(mm)理论重量(kg/m 0.2 1.570.75 5.89 1.814.13 0.25 1.960.8 6.28215.7 0.3 2.360.97.07 2.217.27 0.35 2.7517.85 2.519.36 0.4 3.14 1.18.64 2.821.98 0.45 3.53 1.29.42323.55 0.5 3.93 1.310.21 3.225.12 0.55 4.32 1.410.99 3.527.48 0.6 4.71 1.511.78 3.829.83 0.65 5.1 1.612.56 3.930.62 0.7 5.5 1.713.35431.4 技术信息 薄钢板是符合厚度等于或小于4mm的各种热轧和冷轧的钢板。有许多品种:热轧普通薄钢板、冷轧普同薄钢板、热轧优质薄钢板、冷轧优质薄钢板以及电镀、镀锌、涂层、复合等薄钢板。 虽然品种多,材质也不同,但其尺寸、外形、重量计算方法大同小异,计算公式: 2 )=0.00785*宽*厚 W(kg/m 中厚钢板----厚度大与4mm的钢板,包括普通厚钢板(如普通碳素钢、低合金钢、桥梁钢、花纹钢及锅炉钢等钢板)和优质厚钢板。 中厚钢板尺寸重量 厚度(mm)理论重量 2) (kg/m 厚度(mm) 理论重量 (kg/m2) 2 厚度(mm)理论重量 (kg/m) 4.53 5.3316125.638298.3 539.2518141.340314 5.543.182015742329.7 647.1622172.744345.4 754.9524188.445353.25 862.82519 6.2546361.1 970.6526204.148376.8 1078.628219.850392.5 1186.3530235.552408.2 1294.232251.254423.9 13102.134266.955431.75 14109.935274.7556439.6 1511 7.7536282.658455.3