Geophys.J.Int.(2004)157,1–14doi:10.1111/j.1365-246X.2004.02180.x
G J I G e o d e s y ,p o t e n t i a l ?e l d a n d a p p l i e d g e o p h y s i c s
Current shortening across the Himalayas of Nepal
F .Jouanne,1,?J.L.Mugnier,2J.F .Gamond,3P .Le Fort,2M.R.Pandey,5L.Bollinger,4M.Flouzat 4and J.P .Avouac 4
1LGCA,UMR CNRS 5025,Universit′e de Savoie 2LGCA,
UMR CNRS 5025,Universit′e J.Fourier
3LGIT,UMR CNRS 5559,Universit′e J.Fourier 4CEA,LDG,Bruyeres le Chatel,France
5Department of Mines and Geology,Lainchaur,Katmandu,Nepal
Accepted 2003November 1.Received 2003October 30;in original form 2002March 22
S U M M A R Y
Underthrusting of the Indian lithosphere beneath the Himalayas occurs during the Quaternary period along a gently north-dipping main basal detachment (main Himalayan thrust:MHT),from which the southernmost emergent ramp (main frontal thrust:MFT)branches.Historical seismicity shows that slip on the MHT is frequently accommodated through M >8shallow earthquakes,but shows a seismic gap in western Nepal.This absence of major historical earthquakes in western Nepal can be explained either by an aseismic slip on the MHT or a long-lived elastic strain accumulation.To test these hypotheses,the present-day displacement ?eld has been measured for a GPS network formed of 35sites.The updated solution presented in this paper combines data from 1995,1997,1998and 2000measurements.The lack of deformation (less than 3·10?8yr ?1)through the outer belt does not ?t with a regional aseismic slip along the southern part of MHT.A less than 3mm yr ?1aseismic slip could nonetheless affect restricted areas of the outer belt.In contrast,a strain accumulation of more than 30·10?8yr ?1is measured south of the Higher Himalayas,in a zone where an intense microseismicity re?ects a stress build-up.It is presumably generated by locking of the aseismic creep that occurs along the MHT beneath the Higher Himalayas and Tibet.The displacement ?eld is simulated by a dual-dislocation model that takes into account the pattern of microseismicity,and particularly a segmentation between central and western Nepal.The best ?t between the measured and simulated displacement ?elds is obtained with 19mm yr ?1thrust and 0–1mm yr ?1dextral strike-slip components along a 117?NE dislocation locked to a depth of 20–21km beneath western Nepal,and 19–20mm yr ?1thrust and 0–2mm yr ?1dextral strike-slip components along a 108?NE dislocation locked to a depth of 17–21km beneath central Nepal.The width of the locked zone between the main frontal thrust and the creeping zone is of the same order,but rather greater,in western Nepal than in central Nepal.Therefore it is expected that M >8earthquakes could occur in western Nepal.
Key words:continental deformation,earthquake location,fault models,Himalayas,Nepal,plate convergence,satellite geodesy.
I N T R O D U C T I O N
The present-day structure of the Himalayas is characterised by un-derthrusting of the Indian lithosphere beneath the chain along the main Himalayan thrust (MHT)(Zhao et al.1993).This structure absorbs about 20mm yr ?1convergence (Bilham et al.1997),that is
?Now at:LGCA UMR CNRS 5025,Campus Scienti?que,Universit′e de Savoie,73376Le Bourget du Lac Cedex,France.E-mail:Jouanne@univ-savoie.fr
nearly half of the convergence between India and Eurasia estimated
by DeMets et al.(1994).
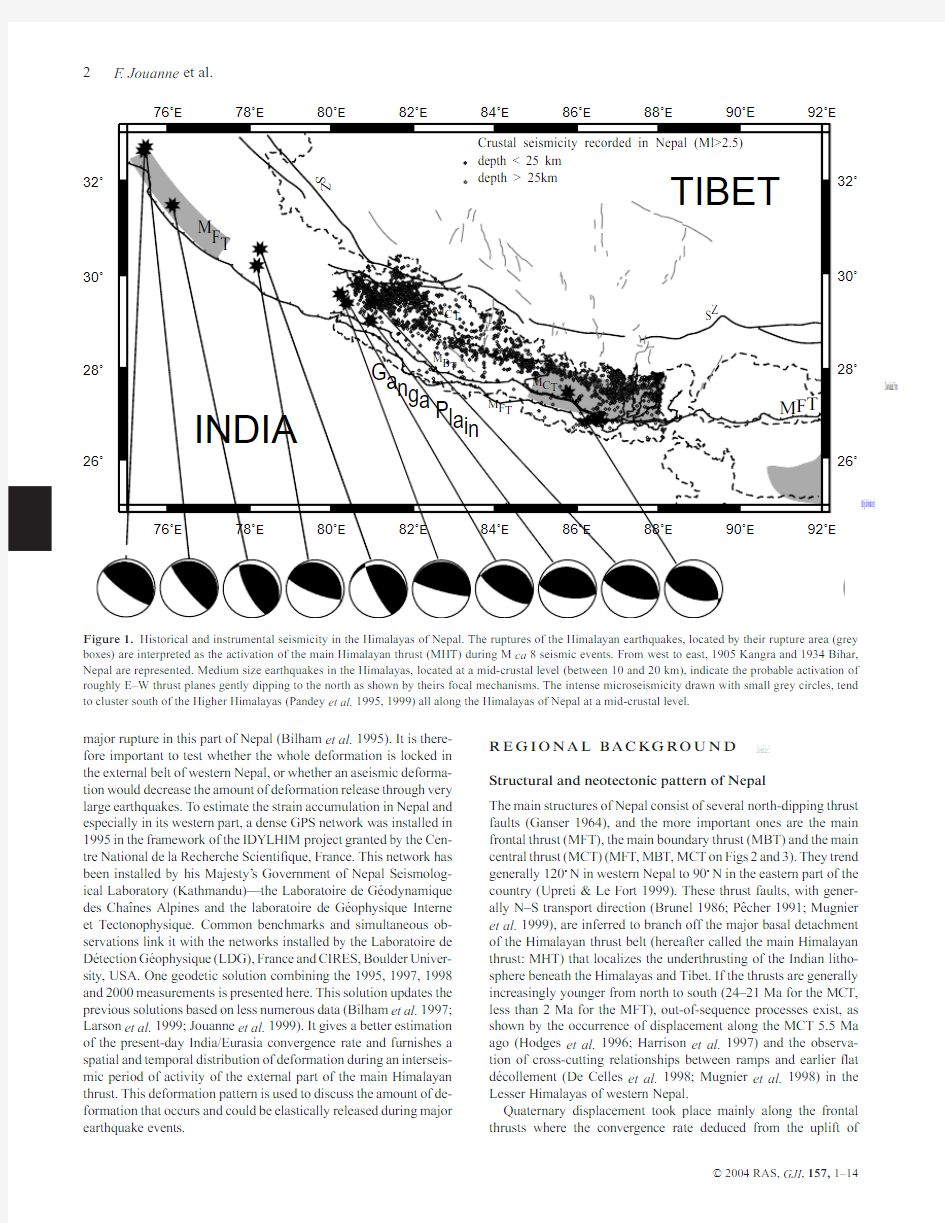
Large earthquakes of magnitude >8affect the MHT that have episodically ruptured segments several hundred kilometres long.This seismic cycle is presently evidenced by numerous studies (Molnar 1987;Bilham et al.1995;Gahalaut &Chander 1997;Avouac et al.2001),and historical seismicity underlines the exis-tence of a major seismic gap between the 1905Kangra and the 1934Bihar,Nepal earthquake areas (Fig.1)in western Nepal.No major earthquake has been clearly recorded in this area over the past three centuries,and possibly since the 1255event,which might be the last
C
2004RAS
1
at China University of Geosciences Wuhan Campus on April 27, 2015
https://www.doczj.com/doc/4d3510693.html,/Downloaded from
2F.Jouanne et al.
76?E78?E80?E82?E84?E86?E88?E90?E92?E Figure1.Historical and instrumental seismicity in the Himalayas of Nepal.The ruptures of the Himalayan earthquakes,located by their rupture area(grey boxes)are interpreted as the activation of the main Himalayan thrust(MHT)during M ca8seismic events.From west to east,1905Kangra and1934Bihar, Nepal are represented.Medium size earthquakes in the Himalayas,located at a mid-crustal level(between10and20km),indicate the probable activation of roughly E–W thrust planes gently dipping to the north as shown by theirs focal mechanisms.The intense microseismicity drawn with small grey circles,tend to cluster south of the Higher Himalayas(Pandey et al.1995,1999)all along the Himalayas of Nepal at a mid-crustal level.
major rupture in this part of Nepal(Bilham et al.1995).It is there-fore important to test whether the whole deformation is locked in the external belt of western Nepal,or whether an aseismic deforma-tion would decrease the amount of deformation release through very large earthquakes.To estimate the strain accumulation in Nepal and especially in its western part,a dense GPS network was installed in 1995in the framework of the IDYLHIM project granted by the Cen-tre National de la Recherche Scienti?que,France.This network has been installed by his Majesty’s Government of Nepal Seismolog-ical Laboratory(Kathmandu)—the Laboratoire de G′e odynamique des Cha??nes Alpines and the laboratoire de G′e ophysique Interne et https://www.doczj.com/doc/4d3510693.html,mon benchmarks and simultaneous ob-servations link it with the networks installed by the Laboratoire de D′e tection G′e ophysique(LDG),France and CIRES,Boulder Univer-sity,USA.One geodetic solution combining the1995,1997,1998 and2000measurements is presented here.This solution updates the previous solutions based on less numerous data(Bilham et al.1997; Larson et al.1999;Jouanne et al.1999).It gives a better estimation of the present-day India/Eurasia convergence rate and furnishes a spatial and temporal distribution of deformation during an interseis-mic period of activity of the external part of the main Himalayan thrust.This deformation pattern is used to discuss the amount of de-formation that occurs and could be elastically released during major earthquake events.R E G I O N A L B A C KG R O U N D
Structural and neotectonic pattern of Nepal
The main structures of Nepal consist of several north-dipping thrust
faults(Ganser1964),and the more important ones are the main
frontal thrust(MFT),the main boundary thrust(MBT)and the main
central thrust(MCT)(MFT,MBT,MCT on Figs2and3).They trend
generally120?N in western Nepal to90?N in the eastern part of the
country(Upreti&Le Fort1999).These thrust faults,with gener-
ally N–S transport direction(Brunel1986;P?e cher1991;Mugnier
et al.1999),are inferred to branch off the major basal detachment
of the Himalayan thrust belt(hereafter called the main Himalayan
thrust:MHT)that localizes the underthrusting of the Indian litho-
sphere beneath the Himalayas and Tibet.If the thrusts are generally increasingly younger from north to south(24–21Ma for the MCT,
less than2Ma for the MFT),out-of-sequence processes exist,as
shown by the occurrence of displacement along the MCT5.5Ma
ago(Hodges et al.1996;Harrison et al.1997)and the observa-
tion of cross-cutting relationships between ramps and earlier?at
d′e collement(De Celles et al.1998;Mugnier et al.1998)in the
Lesser Himalayas of western Nepal.
Quaternary displacement took place mainly along the frontal
thrusts where the convergence rate deduced from the uplift of
C 2004RAS,GJI,157,1–14
at China University of Geosciences Wuhan Campus on April 27, 2015https://www.doczj.com/doc/4d3510693.html,/
Downloaded from
Current shortening across the Himalayas3
E
26?N
27?N
28?N
29?N
30?N
31?N
82?E84?E86?E88?E90?E 80?E81?E83?E85?E87?E89?E
26?N
27?N
28?N
29?N
30?N
31?N
Figure2.Structural scheme of the Himalayas of Nepal and location of GPS points.
Holocene terraces is of the order of21.5±2.5mm yr?1in cen-
tral Nepal(Lav′e&Avouac2000)and19±6mm yr?1(Mugnier
et al.2003)in western Nepal.The observations of Quaternary
metric displacement in the frontal thrust belt indicate that the co-
seismic displacement episodically reaches the surface(Delcail-
lau1992;Nakata et al.1998).The consistency of the long-term
contraction rates across the frontal part of the Himalayan thrust
system,and the aseismic slip rate simulated below the Higher
Himalayas,suggests that detachment slip ef?ciently accommodates
most of the contraction and that most of this slip occurs through
discrete seismic events(Lav′e&Avouac2000;Mugnier et al.
2003).
Nonetheless other Quaternary motions observed in Nepal are:
(i)Reactivation of the MBT in western Nepal where right-lateral
and north-downward motion has been described(Nakata1989).
(ii)Tectonics along the Bari Gad fault(Fig.2)(Nakata1989;
Y eats&Lillie1991)affected by right-lateral motion or extension
depending on the orientation of the segment of the fault.
(iii)Moderate E–W extension with a left-lateral component,less
than1mm yr?1(Fort et al.1982)across the Thakkhola half-graben
located north of the Higher Himalayas in southern Tibet at the
boundary between western and central Nepal(Fig.2).
Seismicity
Present-day deformation of the Himalayas is characterized by big
earthquakes.Three of these earthquakes(1905,1934and1950)with
magnitude around8are due to the underthrusting of India under Hi-
malayas(Molnar1987;Molnar&Pandey1989)and have ruptured
nearly half of the chain in the past100yr.For Nepal,historical
seismicity is mainly deduced from major damage in the Kathmandu
valley,and indicates major earthquakes in1255,1408,1681,1810,
1833and1866.The1934Bihar,Nepal earthquake,that ruptured
a100–300km long part of the Himalayan arc(Molnar&Pandey
1989),seems to be the recurrence of some of these events(Bilham
et al.1995),whereas the1803,1833and1866events could be re-
lated to the rupture of a segment west of Kathmandu in central Nepal
(Bilham1995).A500–800km seismic gap(Fig.1),between
77?N and84?N(Bilham et al.1995)has not clearly experienced
a great earthquake for more than two centuries(reliable British his-
torical seismicity)and perhaps since the huge1255earthquake.
In this hypothesis,and assuming a constant convergence rate of
20mm yr?1,the maximum slip de?cit in the seismic gap may be
estimated to be15m,which may cause one or several magnitude
>8earthquakes.
Intermediate magnitude(5–7)events have been recorded in
the Himalayan-Tibet area.The focal mechanisms indicate the oc-
currence of shallow(10–20km)earthquakes beneath the Lesser
Himalayas with focal solutions interpreted as the activation of thrust
planes gently dipping to the north(Ni&Barazangi1984;CMT so-
lutions on Fig.1from Singh2000).A detailed study has been per-
formed for one of these earthquakes.The M6.6Uttarkashi earth-
quake,west of Nepal,in India has been studied in detail by Cotton
et al.(1996),and could exemplify these type of events.It indicated
that the seismic event had been initiated at a depth of12±3km
south of the Great Himalayas along a surface dipping11?towards
the North and was characterized by a southward propagation of
the rupture along a20–25km segment of the MHT.The rupture
stopped close to the bottom of a crustal ramp inferred in this area
by Srivastava&Mitra(1994).
An intense microseismicity and frequent medium size earth-
quakes tend to cluster south of the Higher Himalayas(Pandey et al.
1995,1999)all along the Himalayas of Nepal(Fig.1)at a mid-crustal
level(between10and20km).A detailed study of these microseis-
mic clusters suggests a segmentation of the Himalayan arc(Pandey
C 2004RAS,GJI,157,1–14
at China University of Geosciences Wuhan Campus on April 27, 2015https://www.doczj.com/doc/4d3510693.html,/
Downloaded from
4F.Jouanne et al.
CENTRAL NEPAL
Figure3.Cross-sections and build-up consequence of a lateral
et al.1999)and two major discontinuities segment the microseismic-ity belt at82.5?E and86.5?E.In western Nepal(between longitudes 80.5?E and82.5?E)a cluster is oriented ca118?NE,in central Nepal (between82.5?E and86.5?E)it is orientated ca108?NE,and in east-ern Nepal(between86.5?E and88.5?E)ca95?NE.The projection along cross sections of the microseismic events(Fig.3)reveals a no-ticeable change in shape of the clusters between central and western Nepal(Pandey et al.1999):at the longitude of Katmandu(central Nepal)the cluster has a rounded form and is located in the vicinity of the?at-ramp transition of the MHT;in western Nepal the cluster is elongated and nearly horizontal.These clusters are interpreted to re?ect stress building in the interseismic period,during which the d′e collement beneath the Lesser Himalayas probably remains locked (Pandey et al.1995;Bilham et al.1997;Cattin&Avouac2000)with aseismic creep being located beneath the Higher Himalayas.It may thus be inferred that these clusters following the southern bound-ary of the Higher Himalayas of Nepal,mark the tip of the aseismic slip zone beneath the Higher Himalayas and southern Tibet,and that the transition from the aseismic creep dislocation zone to the locked zone does not occur in the same context in central and west-ern Nepal:in central Nepal this transition corresponds to the lower part of a ramp,close to a?at-ramp connection of the MHT;while in western Nepal it is located along a gently dipping segment of the MHT.G E O D E T I C A N A LY S I S A N D R E S U LT S
Network set-up
Networks were installed in Nepal in1991,1992,1995,1997,1998
and2000by several French(LDG and CNRS)and American (Colorado University)Institutions in collaboration with His
Majesty’s Government of Nepal.
The Colorado University network,measured for the?rst time in
1991,covered Nepal with points located from the Higher Himalayas
to the Himalayan foreland(Bilham et al.1997).The LDG network
(1995,1998,2000)is focused on the deformation at the longitude
of Katmandu and the IDYLHIM network(1995,1997,1998,2000)
is designed to study the possible central Nepal/western Nepal seg-
mentation and to evaluate the slip de?cit in the seismic gap between
the1934Bihar,Nepal earthquake and the1905Kangra earthquake.
The IDYLHIM network presents a dense arrangement of observa-
tion points in the Siwaliks of the outer Himalayas,designed to test
the existence of possible aseismic creep along the frontal set of Quaternary thrusts,as inferred in central Nepal from spirit levelling comparisons(Jackson&Bilham1994).
These various surveys are connected by common benchmarks and
by simultaneous observations in1995,1997,1998and2000.In this
study,the deformation?eld has been estimated using the available
C 2004RAS,GJI,157,1–14
at China University of Geosciences Wuhan Campus on April 27, 2015https://www.doczj.com/doc/4d3510693.html,/
Downloaded from
Current shortening across the Himalayas5 Table1.Summarizes the observation at the GPS sites and indicates the date of observations,the number of sessions per point and the time span of the observation sessions.
Latitude Longitude Campaign
Station Network deg deg number1995199719982000 AMP0IDYLHIM28.03082.2473244 BAL0LDG27.74585.794213
BBP0IDYLHIM28.19682.094234
BMT0IDYLHIM27.78682.5403314 BR W0CIRES+IDYLHIM27.50783.4182246 CHI0IDYLHIM28.64181.316233
CHP0IDYLHIM27.95182.5043242
DAD2IDYLHIM29.33480.601235 DDLO IDYLHIM29.53480.775233 DLP0IDYLHIM28.98382.8183333
DMN0IDYLHIM27.60885.1083522 GMB0LDG27.89685.895222
GUT0IDYLHIM28.82481.353234
HET0LDG27.31685.0083223 JML0IDYLHIM29.27782.191233
JOM0CIRES+IDYLHIM28.78183.7182122
KKN0LDG27.80085.279341016 KRN2IDYLHIM27.54382.788236 KUS0IDYLHIM28.01082.095234 MAH0CIRES+IDYLHIM28.96380.14833411 MUL0IDYLHIM28.24982.3473334
NAGA CIRES27.69385.521333138 NIJ0LDG27.18385.187223
NPJ0CIRES+IDYLHIM28.13481.575461565 PKI0LDG27.57585.398341112 PKR0IDYLHIM28.19983.9783122 POK0CIRES+IDYLHIM28.19983.9783393 RAM0LDG28.19983.9783125 SHP0IDYLHIM29.52780.72141334 SKA0IDYLHIM28.58381.6343141910 SKT0CIRES+IDYLHIM28.58681.63539143 SMK0CIRES+IDYLHIM29.96781.8263844
SPS2IDYLHIM28.40781.6913333 SY A0LDG28.17185.3293223 TAN0CIRES+IDYLHIM27.87483.5543244
1995–2000CIRES data,and the LDG and CNRS(IDYLHIM,IT and PNRN programs)observations.
Data acquisition
Table1summarizes the observation duration at the GPS sites and indicates the date of observations,the number of sessions per point and the time span of the observation sessions.In1995,both12hr and24hr sessions were conducted.In1997,1998and2000,24hr sessions were systematically conducted.The points were generally observed for three sessions.The measurements in1995,1997,1998 and2000(IDYL and LDG networks)were taken with Ashtech dual-frequency receivers.In1995,both codeless and z-code receivers were used,whereas z-code receivers were systematically used in 1997,1998and2000.Choke-ring antennas have been used since 1997.
GPS data analysis
Data were analysed with the Bernese V4.2software(Beutler et al. 2001)in the ITRF97reference frame using precise orbits(Boucher et al.1999),earth rotation parameters and data from IGS stations (Table2).The antenna phase-centre offsets and the in?uence of elevation on phase-centre variations were corrected using the IGS antenna phase-centre table.The troposphere-induced propagation delays were estimated from the observations,with troposphere pa-rameters being estimated every2hr.
Analysis of1995data
The1995data set formed by CIRES,LDG and IDYLHIM data (Table1)and IGS station measurements(LHAS,KIT3,TAIW, SHAO,IRKT,IISC,POL2)were analysed according to the following strategy:an ionosphere-free analysis without ambiguity resolution in order to assess residual;a quasi-ionosphere-free resolution strat-egy(Beutler et al.2001)allowing all data to be mixed in a single run with or without code measurement.Troposphere parameters were estimated with observations being weighted as a function of satellite elevation.The mean repeatability of these observations for1995is 2.5mm,3mm and20mm for the north,east and vertical com-ponents respectively.The increase in repeatability versus baseline length(0.7ppb for the north and0.9ppb for the east component)in-dicates that both orbits,considered as?xed,and the reference frame are well de?ned.
Analysis of1997,1998and2000data
The1997,1998and2000data sets(Table1)were analysed with IGS station data(1997:BAHR IISC,IRKT,KIT3,LHAS,POL2,TAIW, SHAO,WUHN,XIAN;1998:BAHR,IISC,IRKT,KIT3,LHAS, POL2,SHAO,XIAN,WUHN;2000:BAHR,LHAS,IISC,IRKT,
C 2004RAS,GJI,157,1–14 at China University of Geosciences Wuhan Campus on April 27, 2015https://www.doczj.com/doc/4d3510693.html,/ Downloaded from
6F.Jouanne et al.
Table2.Velocities and associated1σuncertainties derived from the1995,1997,1998and2000observations expressed in the Eurasia?xed velocities of BOR1,BRUS,JOZE,KOSG,METS,ONSA,IRKT,POTS,WTZR,ZIMM,ZWEN set to zero and velocities of KIT3and POL2set to2mm yr?1N and 0.5mm yr?1E),and in the India?xed reference frame de?ned by the minimization of the displacements of IISC in India,BR W0,KRN2,MAH0,NIJ0,NPJ0 points located in the Ganga Plain in Nepal(the motion of India relative to Eurasia has been described,in our analysis,by the pole,latitude28.5?N,longitude 22.1?E,rotation0.4?Myr?1).
Eurasia Fixed India?xed latitude longitude Campaign
GPS points deg deg number Northσnorth Eastσeast Northσnorth Eastσeast AMP028.0382.247333.630.789.550.8?0.261.18?0.071.12 BAHR26.2150.61320.310.363.290.521.4910.311.14 BAL027.74585.794230.852.288.412.32?4.462.44?1.372.46 BBP028.19682.094234.771.614.191.542.321.80.651.74 BMT027.78682.54334.470.689.470.70.351.10.101.06 BRW027.50783.418230.791.710.511.54?3.101.9?0.921.72 CHP027.95182.504335.451.9410.91.981.682.120.482.12 DAD229.33480.601228.671.967.671.76?4.572.16?1.171.92 DDL029.53480.775230.512.267.372.02?2.962.42?0.752.16 DLP028.98382.818321.431.37.751.2?12.111.38?3.301.26 DMN027.60885.108332.740.649.290.64?2.271.08?0.691.04 GMB027.89685.895229.972.268.22.14?5.352.42?1.632.3 GUT028.82481.353233.661.569.681.50.251.780.071.68 HET027.31685.008334.040.989.651.18?0.981.32?0.301.44 IISC13.02177.57431.650.3816.870.380.041.020.020.88 JML029.27782.1912261.89.891.68?6.991.96?1.851.82 JOM028.78183.718223.671.79.081.56?9.981.9?2.801.74 KKN027.885.279333.430.5810.130.58?1.451.06?0.441 KRN227.54382.788234.142.967.652.6?0.503.1?0.152.72 KUS028.0182.095230.711.027.231.4?3.491.34?0.981.6 LHASA29.65791.104416.010.2419.340.22?12.550.9?3.960.86 MAH028.96380.148333.210.869.840.760.371.220.101.1 MUL028.24982.347334.281.589.081.740.211.80.061.92 NAGA27.69385.521331.780.3410.520.32?2.940.94?0.900.88 NIJ027.18385.187238.681.969.712.13.242.141.002.24 NPJ028.13481.575433.40.4210.090.38?0.050.98?0.010.88 PKI027.57585.398334.330.5610.650.6?0.551.04?0.171 PKR028.19983.978230.791.212.891.08?2.421.5?0.701.36 POK028.19983.978334.560.7610.120.860.111.160.031.18 RAM028.01585.222327.290.5612.590.54?6.070.86?1.820.78 SHAO31.1121.24?5.370.311.710.4?27.330.88?15.131.22 SHB029.52780.721427.510.528.790.48?5.371?1.360.9 SHP029.01280.636334.670.869.670.761.501.240.391.1 SKA028.58381.634330.890.446.490.4?3.231?0.880.9 SKT028.58681.635330.520.489.420.46?2.871?0.780.92 SMK029.96781.826321.751.189.371.1?10.801.44?2.731.34 SPS228.40781.691333.940.9810.10.880.441.320.121.18 SY A028.17185.329326.960.811.370.78?6.861.18?2.041.12 TAEJ62.03127.372?3.22.188.711.98?29.432.32?14.862.34 TAIWAN25.021121.5372?5.43118.641.22?21.681.32?12.341.68 TAN027.87483.554335.10.7810.220.780.761.180.221.12 WUHN30.53114.33?4.660.511.020.58?28.300.98?13.801.2 XIAN34.37109.222?7.331.829.182.08?28.212.02?11.862.3
KIT3,POL2,SHAO,WUHN)with resolution of carrier-phase am-biguities using:an ionosphere-free analysis without ambiguity res-olution in order to assess residuals;Wuebbena–Melbourne ambigu-ity resolution(W¨u bbena1985;Melbourne1985);and resolution of ambiguities using the ionosphere-free combination introducing the solved Wuebbena–Melbourne ambiguities.
The mean repeatability of these observations,for the north,east and vertical components respectively,is:1.8,4and10mm in1997;
1.5,1.8and6mm in1998;and0.9,
2.2and6.7mm in2000.The orbits,considered to be?xed,and the reference frame are well de-?ned as shown by the relation between repeatability and baseline length for the north and east components respectively:2and10ppb in1997;0.04and0.01ppb in1998;and,4and?2ppb in2000.
For each campaign,one normal equation and its weighting coef-
?cient were obtained by combining the daily normal equations and
the overall weekly solutions obtained from CODE(Center Orbit Determination Europe).
To test the hypothesis of displacement linearity through time,
time series illustrating baseline variations have been plotted(ex-
amples are given on Fig.4).The analysis of time series does not
allow demonstration of non-linearity of displacements.The mis?t
locally evidenced between the linear interpolation is not meaningful
because a colourated noise,revealed in the continuous GPS stations
time series(Mao et al.1999),has to be considered.We have not
performed vertical velocity estimation,because different models of
antenna have been used and repeatabilities of vertical component
C 2004RAS,GJI,157,1–14
at China University of Geosciences Wuhan Campus on April 27, 2015https://www.doczj.com/doc/4d3510693.html,/
Downloaded from
Current shortening across the Himalayas
7
Lhasa - NpJ0
Mah0/Shb0
smk0/dlp0
-0.003
-0.002-0.0010.001
0.0020.003
0.004B a s e l i n e v a r i a t i o n i n m e t e r
B a s e l i n e v a r i a t i o n i n m e t e r
B a s e l i n e v a r i a t i o n i n m e t e r
B a s e l i n e v a r i a t i o n i n m e t e r
B a s e l i n e v a r i a t i o n i n m e t e r
B a s e l i n e v a r i a t i o n i n m e t e r
Pok0 / Brw0
Lhasa-Shb0
B a s e l i n e v a r i a t i o n i n m e t e r
B a s e l i n e v a r i a t i o n i n m e t e r
B a s e l i n e v a r i a t i o n i n m e t e r
B a s e l i n e v a r i a t i o n i n m e t e r
Ram0-Het0
B a s e l i n e v a r i a t i o n i n m e t e r
B a s e l i n e v a r i a t i o n i n m e t e r
Figure 4.Examples of time series for points measured three or four times.Errors bars are drawn for a 1σcon ?dence level.As shown on these ?gures,baselines variations at different scales from long baselines (Lhasa-Npj0or Lhasa-Shb0)to short baselines (Pok0-Brw0,Smk0-Dlp0)seem to occur at constant rates for the horizontal component.
(from 20mm in 1995to 6.7mm in 2000)do not allow an accurate determination of vertical displacements.
Velocities were then obtained from the weighted combination of campaign normal equations (1995,1997,1998and 2000),assuming linear displacements.A weight of 0.0022,derived from Bernese analysis,has been adopted for the less accurate 1995campaign,whereas a weight of 0.0018has been adopted for the 1997,1998and 2000campaigns.Estimated velocities
A natural reference frame for the India –Eurasia collision zone is the Eurasia ?xed reference.It is de ?ned by minimizing the velocities of stations located in stable Asia and Europe using a six-parameters Helmert transformation (three translation and three rotation parame-ters):the velocities of BOR1,BRUS,JOZE,KOSG,METS,ONSA,IRKT,POTS,WTZR,ZIMM (present in 1995,1997,1998and 2000combined solutions),ZWEN (present in 1998–2000solutions)were minimized and the velocities of KIT3and POL2(present in 1995,1997,1998and 2000)located in the Kazakh platform (Abdrakhma-tov et al.1996)were adjusted to 2mm yr ?1N and 0.5mm yr ?1E
(Figs 5a and b)as suggested by Kogan et al.(2000).To obtain a more
readable velocity map in the Nepal area,characterized by important displacements and high-displacement gradients,vectors were also expressed in the India ?xed reference frame (Fig.6).This refer-ence frame,has been de ?ned by the determination of the rotation pole Eurasia/India (latitude:28.5?N,longitude:22.1?E,rotation:0.4?Myr ?1)that accounts for the displacements of IISC (Southern India),BR W0,KRN2,MAH0,NIJ0and NPJ0in the Ganga plain,in the Eurasia ?xed reference frame.
S I S M O T E C T O N I C A N D T E C T O N I C I N T E R P R E TAT I O N India/Eurasia motion
Points located on the Indian lithosphere,south of the Himalayas,have geodetic displacements signi ?cantly lower than Nuvel 1A NNR predictions (Argus &Gordon 1991;DeMets et al.1994)(Table 2and Figs 5a and b).For example the estimated motion of Bangalore (IISC)is 36mm yr ?1directed 28?NE (i.e.signi ?cantly slower than the 47mm yr ?1Nuvel 1A NNR prediction directed 24?NE),but is
C
2004RAS,GJI ,157,1–14
at China University of Geosciences Wuhan Campus on April 27, 2015
https://www.doczj.com/doc/4d3510693.html,/Downloaded from
8F .Jouanne et al.
60E
60E 80E
80E 100E
100E
120E
120E
20N
20N
40N
40N
80E
82E
84E
86E
88E
90E
80E
82E
84E
86E
88E
90E
26N
26N
28N
28N
30N
30N
30 mm year ?1
INDIA
G A N G A
P L A I N
TIBET
95% confidence
ellipse
Figure 5.Velocities drawn in the stable Eurasia reference.(a)Selected velocities of Nepal network frame (only ?ve points are drawn to make the ?gure readable)and selected continuous GPS stations in the Eurasia ?xed reference frame.This reference frame has been de ?ned as follows:the velocities of BOR1,BRUS,JOZE,KOSG,METS,ONSA,IRKT,POTS,WTZR,ZIMM,ZWEN were minimized and the velocities of KIT3and POL2located in the Kazakh platform (Abdrakhmatov et al.1997)were adjusted to 2mm yr ?1N and 0.5mm yr ?1E.(b)Velocities of the 34sites of the LDG-IDYLHIM network in the Eurasia ?xed reference frame.
in accordance with the 37mm yr ?1value directed 22?NE GPS pro-posed by Paul et al.(2001).The current displacement of Bangalore is consistent with the displacement predicted using the revised plate reconstruction proposed by Gordon et al.(1999)(37mm yr ?1with a 38?NE azimuth).
This discrepancy with the plate reconstruction model,already re-ported by several authors (Chen et al.2000;Shen et al.2000;Paul et al.2001;Wang et al.2001),may have different origins:dif ?cul-ties in establishing the geological plate circuit (mainly in the Nuvel 1A model)in a model using sea ?oor spreading rates,transform-fault strikes and focal mechanisms;or,the existence of present-day shortening of the oceanic lithosphere,south of the nearly stable In-dian continental lithosphere (Paul et al.2001).In other words,the missing shortening might be absorbed through the oceanic domain located between the stable Indian margin and the oceanic ridges that limit the Indian plate.This hypothesis is also supported by
C
2004RAS,GJI ,157,1–14
at China University of Geosciences Wuhan Campus on April 27, 2015
https://www.doczj.com/doc/4d3510693.html,/Downloaded from
Current shortening across the Himalayas
9
80?
82?
84?
86?
2626?
2828?
3030?
81?
83?
85?
87?
2727?
2929?
3131?
Figure 6.Velocities of the 34sites of the LDG-IDYLHIM network in the India ?xed reference frame.This reference frame,has been de ?ned by the
determination of the Eurasia/India rotation pole (latitude:28.5?N,longitude:22.1?E,rotation:0.4?Myr ?1).It allows to account for the displacements of IISC (southern India),BR W0,KRN2,MAH0,NIJ0and NPJ0in the Ganga plain,Eurasia being considered ?xed.
signi ?cant seismicity in the oceanic domain of the Indian plate and the observed recent folding of the lithosphere (Curray &Munasinghe 1989).
Active deformation of Himalayas
From the velocities expressed in the India ?xed reference frame (Fig.6),a number of features can be highlighted:
(i)Points located in the Ganga plain do not exhibit signi ?cant residual displacements.
(ii)Points located on the ?rst anticlines are also not affected by major motions;in view of this lack of displacement between these points and the benchmarks embedded in the Ganga plain,it may be inferred that there is an absence of major aseismic movements along the MHT that reaches the ground surface just south of these folds.(iii)A north –south velocity gradient is evidenced between the points located in the outer belt and those located in the Lesser Hi-malayas or in the Higher Himalayas.
(iv)There is also no evidence of dextral strike-slip movement along the MBT in western Nepal (Nakata 1989);this feature appears to be of second order compared with the Himalayan convergence,as suggested by the displacement rate of 1mm yr ?1(Nakata 1989).(v)There is no present-day extension along the Thakola graben,as shown by the lack of velocity difference between the points of Jo-mosson (JOM0)in the southern part of the east side of the Thakola graben,and the points of Dolpo (DLP0),and the overall E –W ex-tension along the studied segment of the Himalayan chain is weak
and diffuse.
(vi)There is an E –W shortening in the Higher Himalayas north of Kathmandu (Fig.7)which is compatible with the 1997January 1seismic event in this area.
This Ml 5.6seismic event has occurred,at 18km depth,along a plane dipping 85?to the west with a 20cm displacement of the hanging-wall towards the east.The 1.7cm horizontal component at the source does not probably induce a detectable horizontal displacement at the stations RAM0and SY A0.Nonetheless,postseismic deformation,evidenced by the postseismic microseismicity lineament could af-fect the displacement of these two stations.This event is associated with an eastward displacement of the hangingwall whereas other fault plane solutions of M5–6earthquakes indicate southward dis-placement of the hangingwall.This suggests a structural anomaly related with a lateral variation of the MHT geometry.
Uniform strain rate tensors are calculated to show more clearly the strain location and shortening-axis variations (Fig.8)through the Himalayan belt.Uncertainties in strain rates have been obtained using the following steps for a Monte Carlo simulation of errors:(i)Diagonalisation of variance –covariance matrix.
(ii)Perturbation of velocity vectors in the basis formed by eigen-vectors,where only the non-diagonal elements are non-nul,using random value with a normal distribution scaled to represent a 95per cent con ?dence level.
C
2004RAS,GJI ,157,1–14
at China University of Geosciences Wuhan Campus on April 27, 2015
https://www.doczj.com/doc/4d3510693.html,/Downloaded from
10F .Jouanne et
al.
Figure 7.Present-day deformation at the longitude of Kathmandu.Velocity
?eld expressed by reference to the NIJ0benchmark in the Ganga plain.Strain-rate tensors underline the existence of an E –W shortening north of Kathmandu,also expressed by a moderate earthquake indicating a coseismic E –W horizontal displacement.
(iii)Decomposition of perturbed vectors in N,E,up components.(iv)Estimation and drawing of perturbed strain rate tensors.The E –W extension that characterizes the southern Tibet area is evidenced on the single mesh of the network that belongs to this area (i.e.the SMK0-SHB0-JML0triangle).The area that undergoes most of the current deformation is characterized by a strong short-ening that exceeds 1.10?7yr ?1and locally reaches 3·10?7yr ?1.It is surrounded to the north by the Higher Himalayas –southern Tibet area,and to the south by the outer belt of the Himalayas affected by a nearly negligible present-day deformation.This strain distribution suggests that it could be induced by displacement locking along the MHT below the Lesser Himalayas,around the microseismicity cluster.In this hypothesis,the Higher Himalayas are located above the northern part of the MHT affected by aseismic creep,the Lesser Himalayas undergo strain accumulation induced by displacement locking,and the Outer Himalayas,located above the locked part of the MHT,is characterized by a lack of any considerable instanta-neous deformation.
Fig.8also illustrates a spatial variation in the orientation of the shortening-axis between western and central Nepal,east of the 83?E meridian.In this area,there is both a change in orientation of micro-seismicity clusters and a change in shortening-axis directions.This could indicate a major change in the MHT geometry,as proposed by Larson et al.(1999).
Simulation of the present-day velocity ?eld
The hypothesis that Nepal experiences interseismic strain and stress accumulation,as revealed by the microseismicity distribution and geodetic velocity ?eld,has been expressed by several authors
(Pandey et al.1995,1999;Bilham et al.1997;Larson et al.1999;Jouanne et al.1999;Cattin et al.2000).In this study,the existence of MHT segmentation is tested with a dislocation model using two dislocations extending down-dip from the bottom of the locked zone to a lower edge located at numerical in ?nity affected by a uniform aseismic creep,one for central Nepal and the other for western Nepal.It is assumed that the interseismic deformation is related to uniform aseismic creep (Okada 1985)on buried planar thrust-fault surfaces locked at their southern tips.These dislocations approxi-mate ductile deformation of the lower crust around the MHT,and their tips correspond to a ?at-ramp connection or a ductile –brittle transition.
The strike of the dislocations is assumed to be parallel to the av-erage structural direction (MBT,MFT,etc.)and to the direction of the microseismicity clusters i.e.,close to 105?NE for central Nepal and 117?NE for western Nepal (Fig.9).The microseismicity distri-bution and the horizontal velocity ?eld are both used to de ?ne the limits of the dislocations:the simulated horizontal displacements must ?t with the horizontal displacements measured by GPS,and the southern boundary of the dislocations must be located in the microseismicity clusters.We have performed a systematic search through space parameters to seek the best ?tting set of parameters.We have considered constant orientations of the dislocations,well constrained by the trend of the microseismicity clusters assumed to re ?ect the stress build-up at the southern tip of the dislon (transition between creeping and absence of displacement along the MHT).The space parameters have been determined by:the displacement components (from 19–21mm yr ?1for the thrust component to 0–5mm yr ?1for the dextral strike-slip component);the dip of the dislocations (from 9to 12?);the depths of the tip of the two dislo-cations (from 15to 25km);and the horizontal location of the tip of the dislocations (?10to +10km in the microseismicity cluster).To test all the possibilities described above,30262runs have been performed.We have selected,as the most probable solutions,the ?ve parameter sets characterized by the ?ve lowest WRMS.The best solutions are dislocations with:a 9–10?dip for the two dislocations;a 19mm yr ?1thrust component for western Nepal and a 19–20mm yr ?1for the central Nepal;0–1mm yr ?1dextral strike-slip component for western Nepal and 0–2mm yr ?1for central Nepal dislocation;and a locking depth around 20–21km for western Nepal and 17–21km for central Nepal.
The existence of 2–3mm yr ?1mis ?t obtained for points of the Siwaliks could suggest an aseismic creep localized in space.This hypothesis would suggest that aseismic creep evidenced from com-parison of spirit levelling in the external part of Himalayas (Jackson &Bilham 1994;Gahalaut &Chander 1997)could be a very local phenomenon and does not give an accurate estimate of an aseismic component on the scale of the Himalayan belt.
This two-dislocation model is close to the one proposed by Larson et al.(1999)in one aspect:the transition zone between the two dislocations is located around 84?E.Nonetheless clear differ-ences are also observed concerning the position and strike of the tip line.The ?t of our dislocation model to the data suggests that the width of the locked zone between the tip of the dislocation and the rupture surface along the MFT,is slightly greater in western Nepal than in eastern Nepal,whereas Larson et al.(1999)calcula-tion suggests a width much greater in eastern Nepal than in west-ern Nepal.For the western dislocation we use twice as many data as Larson et al.(1999)and therefore expect to have a more con-strained solution.For the eastern dislocation,our solution is only valid for central Nepal,and does not apply to eastern Nepal.Further-more,we are aware that the dislocation model is only a ?rst order
C
2004RAS,GJI ,157,1–14
at China University of Geosciences Wuhan Campus on April 27, 2015
https://www.doczj.com/doc/4d3510693.html,/Downloaded from
Current shortening across the Himalayas
11
Figure8.Strain-rate tensors computed from the velocity?eld.Tensors characterized by their eigenvalues and eigenvectors are drawn at the barycenter of triangles used for their computations.Errors in strain rates for a95per cent con?dence level have been obtained using a Monte Carlo simulation of errors. Perturbed tensors simulating the errors for a95per cent con?dence level,are drawn as grey bars around the unperturbed solutions.Strain-rate tensors show an area undergoing most of the current deformation that is surrounded to the north by the Higher Himalayas–southern Tibet area with an E–W extension,and to the south by the outer belt of the Himalayas affected by a nearly negligible present-day deformation.A spatial variation in the orientation of the shortening-axis between western and central Nepal,east of the83?E meridian,illustrates the segmentation of the present-day deformation of Himalayas probably related to a segmentation of the MHT.
approach to the interseismic deformation(Vergne et al.2001).This approach could induce artefacts and neglect any transition zone as inferred by Dragert et al.(1994).Since this approach used alone does not ef?ciently allow determination of the size of the locked zone, and because we have incorporated microseismologic data in our study,we believe that our model is more accurate than the previous one.
Comparison between present-day deformation and neotectonics of the Himalayas
The good?t between measured and simulated velocity?elds sup-ports the hypothesis of two distinct dislocations representing two distinct segments of the ductile shear zones along which the Indian lithosphere is underthrusted beneath Tibet.A comparison with the structural cross-sections proposed through Nepal(Schelling&Arita 1991;De Celles et al.1998;De Celles et al.2001;Mugnier et al. 2003)and with the distribution of the microseismic events(Pandey et al.1999),suggests that the locking line of the dislocation in central Nepal probably corresponds to a geometrical connection between a ?at area and a ramp of the MHT,and that the locking line in western Nepal is located along the lower?at segment of the MHT.In the ?rst case,stress accumulation is well localized.In western Nepal, stress concentration is less localized,and a transition zone between the brittle deformation and the ductile deformation zone,presum-ably,gradually locked the displacement.Furthermore intermediate magnitude earthquakes could occur along the part of the lower?at located in the brittle regime and stop against some ramp acting as a crustal asperity.
The area,from east of the Dhaulaghiri mountain to the Thakkhola graben appears as a major transition:
(i)In the high relief distribution(the>8000m peaks are located east of83?30 ).
(ii)In the microseismicity distribution.
(iii)In the location of Quaternary faulting in the Lesser and Higher Himalayas.
(iv)In the organisation of the drainage pattern(Van der Beek et al.2003).
The current deformation pattern also suggests a transition zone be-tween83?and85?,and has been modelled by a jump in the MHT geometry at84?.The disagreements between the positions inferred from different data sets suggest a broad transition zone.It is sug-gested that the Darma–Bari Gad fault system and the Thakkhola graben roughly delineate(on a map)a crustal wedge(in map view) located at the transition between two different segments of the Hi-malayan detachment above the Indian crust.Around the Bari Gad dextral strike slip fault itself,between the JOM0,DLP0,MUL0 and TAN0points,the adjustment between observed and simulated
C 2004RAS,GJI,157,1–14 at China University of Geosciences Wuhan Campus on April 27, 2015https://www.doczj.com/doc/4d3510693.html,/ Downloaded from
12F .Jouanne et al.
26?
26?
28?
28?
30?
30?
27?
27?
29?
29?
31?
31?
Figure 9.Simulation of the velocity ?eld using a dislocation model.T wo dislocations corresponding to central and western Nepal are used in this interseismic displacement ?eld simulation.Observed displacements drawn with their 95per cent con ?dence level ellipses and simulated displacements are represented for each point of the network illustrating the good ?t between observed and simulated vectors.
displacements underline that a signi ?cant displacement along this strike-slip fault is not required to explain the present-day displace-ments.The Bari Gad fault is then probably not affected by a signif-icant displacement,compatible with the 1.2mm yr ?1.quaternary strike-slip component proposed by Nakata (1989).
Simulations also suggest a present-day oblique slip along the two dislocations (1–2mm yr ?1dextral strike-slip component),in agreement with several observations:
(i)Oblique convergence in the Himalayas and southern Tibet plateau (McCaffrey &Nabelek 1998).
(ii)Displacement partitioning observed along the active Quater-nary faults of the outer belt of western Nepal,i.e.dextral slip along the steep MBT,and long-term,18mm yr ?1,Holocene pure thrusting along the frontal active faults of the Siwaliks (Mugnier et al.1999).The agreement of these long-term contraction rates across the frontal part of the Himalayan thrust system,and the aseismic slip rate simulated below the Higher Himalayas,suggests that detachment slip ef ?ciently accommodates most of the contraction and that most of this slip occurs episodically (Mugnier et al.2003).
C O N C L U S I O N
The geodetic,geological and seismological data presented are used
to understand the present-day deformation process of the Himalayan thrust wedge.In the outer belt,the MHT and its southernmost branch,the MFT,were active during Quaternary times.Histori-cal seismicity indicates that this activity continues in this area,at least episodically,except in western Nepal where it may have been locked for the last 800yr in a seismic gap.Beneath the Higher Hi-malayas and southern Tibet,the MHT accommodates convergence as creep.Between the outer belt and the Higher Himalayas,a mid-crustal microseismicity belt runs parallel to the structural trend of the chain,from east to west.An interruption of the microseismicity
belt between meridian 84?and 82?5separates central Nepal,where the microseismicity clusters correspond to a crustal ramp on the MHT,from western Nepal,where earthquakes are distributed along a rather ?at segment of this thrust surface.These two microseis-micity clusters are interpreted as tip lines where the aseismic creep displacement on MHT surface is locked.This is believed to generate elastic strain in the Himalayan belt and attenuation of displacements towards the foreland.The present-day displacement ?eld was mea-sured by GPS networks from 1995to 2000and the updated solution presented in this paper indicates:
(i)A 37mm yr ?1(with a 38?N azimuth)displacement rate be-tween India and Asia.
(ii)A 21mm yr ?1N –S rate of displacement and a 6.8mm yr ?1E –W component between Tibet (Lhasa)and the Indian plate (NpJ0).(iii)A more than 13·10?8yr ?1deformation-rate along the entire south border of the Higher Himalayan range.
(iv)With an ca 30.10?8yr ?1local shortening rate.
(v)A less than 3.10?8yr ?1deformation rate in the outer part of the Himalayan belt.
The displacement ?eld in Himalayas is satisfactorily simulated by a dual-dislocation elastic model involving thrust and strike-slip com-ponents.The thrust component is 19mm yr ?1and the dextral strike-slip component 1–2mm yr ?1.The mis ?t between the present-day displacement ?eld above the locked zone and the dislocation model is generally not signi ?cant,suggesting that the aseismic component along the external zone of the MHT is negligible.If some current deformation occurs in the outer belt,it necessarily affects restricted zones of the detachment during the six years of the study.The agree-ment of the long-term contraction rates across the frontal part of the Himalayas and the aseismic slip rate simulated below the Higher Himalayas,suggests that most of the slip in the outer belt occurs through earthquakes,and supports the hypothesis of a serious slip de ?cit in western Nepal.The two-dislocation model suggests that the width of the locked zone between the MFT and the creeping
C
2004RAS,GJI ,157,1–14
at China University of Geosciences Wuhan Campus on April 27, 2015
https://www.doczj.com/doc/4d3510693.html,/Downloaded from
Current shortening across the Himalayas13
zone is of the same order,but rather greater,in western Nepal than in central Nepal.As the width of the locked zone gives an upper bound for the width of the rupture,it is suggested that earthquakes as great as,or greater than,those that affected central–eastern Nepal (i.e.≥8.4M from the1934Bihar earthquake)could affect western Nepal.
A C K N O W L E D G M E N T S
Idylhim is a French-Nepali project sponsored by CNRS-INSU (France)programs IDYL,IT and PNRN,and the Idylhim mem-bers are N.L.Chaudury,G.R.Chitrakar,A.Galy,U.P.Gautam,J. P.Glot,B.Kaf?e,B.P.Koirala,P.Leturmy,R.Ranabhat,S.N.Sap-kota,P.L.Shrestha,M.C.Thakury,U.R.Timilsina,U.R.Tiwari, G.Vidal and B.De V oogd.The authors gratefully acknowledge the availability of Himalayan GPS data acquired by the Nepal Survey Department,the University of Colorado at Boulder and the Uni-versity of Alaska at Fairbanks,with support from the US National Science Foundation.The maps in this paper were generated using the public domain Generic Mapping Tools(GMT)software(Wessel &Smith1998).
R E F E R E N C E S
Abdrakkhmatov,K.Y.et al.,1996.Relatively recent construction of the Tien Shan inferred from GPS measurements of present day crustal deformation rate,Nature,384,450–453.
Avouac,J.-P.,Bollinger,L.,Lav′e J.,Cattin R.&Flouzat M.,2001.Le cy-cle sismique en Himalaya,C.RAS.-Serie lia,V olume333,Issue9,15 November2001,pp.513–552.
Beutler,G.et al.,2001.Bernese GPS software version4.2,eds Hugentobler, U.,Schaer,S.,Fridez,P.,Astronomical Institute,University of Berne, Switzerland.
Bilham,R.,1995.Location and magnitude of the1833Nepal earthquake and its relation to the rupture zones of contiguous great Himalayan earth-quakes,Current Science,69(2),155–187.
Bilham,R.,Bodin,P.&Jackson,M.,1995.Entertaining a great earthquake in Western Nepal:Historic inactivity and development of strain,J.Nepal Geol.Soc.,11,73–88.
Bilham,R.,Larson,K.,Freymueller,J.&Idylhim members,1997.GPS measurements of present-day convergence across the Nepal Himalaya, Nature,386,1–94.
CMT,Harvard Centroid Moment Tensor database,1998.
Boucher,C.,Altamimi,Z.&Sillard,P.,1999.The1997International Terres-trial Reference Frame(ITRF97),IERS Technical Note27,Central Bureau of IERS-Observatoire de Paris,Paris.
Cattin,R.&Avouac,J.P.,2000.Modeling mountain building and the seismic cycle in the Himalaya of Nepal,J.G.R.,Solid Earth,105,6,13,389–13,407.
Chen,Z.et al.,2000.GPS measurements from eastern Tibet and theirs implications for India/Eurasia intercontinental deformation,J.geophys. Res.,105,16215–16227.
Cotton,F.,Campillo,M.,Deschamps,A.&Rastogo,B.,1996.Rupture his-tory and seismotectonics of the1991Uttarkashi,Himalayas earthquake, Tectonophysics,258,35–51.
Curray,J.R.&Munasinghe,T.,1989.Timing of intraplate deformation, northeastern India Ocean,Earth planet.Sci.Lett.,94,71–77. Delcaillau,B.,1992.Les Siwalik de l’Himalaya du Nepal oriental,in, M′e moire et Documents de G′e ographie,p.205,′Editions du CNRS,France. De Celles,P.G.,Gehrels G.E.,Quade J.,Ojha,T.P.&Kapp,P.A.,1998. Neogene foreland basin deposits,erosional unroo?ng and the cinematic history of the Himalayan fold-thrust belt,Western Nepal,Geol.Soc. Bulletin,110,2–21.
De Celles,P.,Robinson,D.,Quade,J.,Ojha,T.P.,Garzione C.,Copeland,P. &Upreti B.N.,2001.Stratigraphy,structure,and tectonic evolution of the Himalayan fold-thrust belt in western Nepal,Tectonics,20,487–509.DeMets,C.,Gordon,R.G.,Argus D.F&Stein S.,1994.Effect of recent revisions to the geomagnetic reversal time scale on estimates of current plate motions.Geophys.Res.Lett.,21,2191–2194.
Dragert,H.,Hyndam,R.D.,Rogers,G.C.&Wang K.,1994.Current defor-mation and the width of the seismogenic zone of the northern Cascadia subduction thrust,J.geophys.Res.,99,653–668.
Fort,M.,Freytet,P.&Colchen,M.,1982.Structural and sedimentologi-cal evolution of the Thakkhola Mustang graben(Nepal Himalayas),Z. Geomorph.N.F.,42,75–98.
Gahalaut,V.K.&Chander R.,1997.Evidence for an earthquake cycle in the NW outer Himalayas near78?longitude,from precision levelling observation,Geophys.Res.Lett.,24,225–228.
Ganser,A.,1964.Geology of the Himalayas,p.289,London,Wiley Inter-Science.
Gordon,R.G.,Argus,D.F.&He?in,M.B.,1999.Revised estimate of the angular velocity of India relative to Eurasia(Abstract),EOS,Trans.Am. geophys.Un.,80(46),Fall Meet.Suppl.,F273.
Harrison T.Mark,Ryerson F.J.,Le Fort P.,Yin An,Lovera Oscar M.&Catlos E.J.,1997.A Late Miocene-Pliocene origin for the Central Himalayan inverted metamorphism,E.P.S.L.,V ol.146,Issues1-2,pp.E1-E. Hodges,K.V.,Parrish R.R.&Searle M.P.,1996.Tectonic evolution of the central Annapurna Range,Nepalese Himalaya,Tectonics,15,1264–1291. Jackson,M.&Bilham,R.,1994.Constraints on Himalayan deformation inferred from vertical velocity?eld in Nepal and Tibet,J.geophys.Res., 99,13897–13912.
Jouanne,F.et al.,1999.Oblique convergence in the Himalayas of Western Nepal deduced from preliminary results of GPS measurements,Geophys. Res.Lett.,26,No.13,p.1933.
Kogan,M.G.et al.,2000.Geodetic constraints on the rigidity and relative motion of Eurasia and North America,Geoph.Res.Let.,27,14,2041–2044.
Larson,K.,Burgmann,R.,Bilham,R.&Freymuller,J.,1999.Kinematics of the India-Eurasia collision Zone from GPS measurements,J.geophys. Res.,104,1077–1093.
Lav′e,J.&Avouac,J.P.,2000.Active folding of?uviatile terraces across the Siwaliks Hills,Himalayas of central Nepal,implications for himalayan seismotectonics,J.geophys.Res.,105,5735–5770.
Liu,Q.,Avouac,J.P.,Tapponnier,P.&Zhang,Q.,1992.Holocene movement along the Southern part of the Karakoram fault,in International Sympo-sium on the Karakoram and Kunlun mountains,June5–9,Chin.Acad.of Sci.,Xinjing China.
McCaffrey,R.&Nabelek,J.,1998.Role of oblique convergence in the active deformation of the Himalayas and southern Tibet plateau,Geology,26, 691–694.
Mao,A.,Harrison,C.G.A.&Dixon,T.H.,1999.Noise in GPS coordinate time series,J.geophys.Res.,104,2797–2816.
Molnar,P.,1987.The distribution of intensity associated with the1905 Kangra Earthquake and bounds on the extent of the Rupture Zone,J. Geol.Soc.of India,29,211–229.
Melbourne,W.G.,1985.The Case for Ranging in GPS Based Geodetic Sys-tems,in Proceeding1st International Symposium on Precise Positioning with the Global Positioning System,V ol.1,pp.403–412,ed.Goad,C., US Department of Commerce,Rockville,MD.
Molnar,P.,1987.The distribution of intensity associated with the1905 Kangra earthquake and bounds of the extend of the rupture zone,J.Soc. India,29,221–229.
Molnar,P.&Pandey,M.R.,1989.Rupture zones of Great Earthquakes in the Himalayan region,in Frontiers of Seismology in India,V ol.98,pp. 61–70,ed.Brune,J.N.,Proc.Indian Acad.Sci.
Mugnier,J.L.,Delcaillau,B.,Huyghe,P.&Leturmy,P.,1998.The Break-Back Thrust splay of the Main Dun Thrust:evidence for an intermediate displacement scale between seismic/aseismic fault slip and?nite geometry of thrust systems,J.Struct.Geol.,20,857–864.
Mugnier,J.L.,Leturmy,P.,Mascle,G.,Huyghe,P.,Chalaron,E.,Vidal, G.,Husson,L.&Delcaillau,B.,1999.The Siwaliks of Western Nepal: geometry and kinematics,in Advances on the Geology of the Himalaya, focus on Nepal,V ol.17,pp.629–642,eds Le Fort,P.&Upreti,B.N.,J. Asian Earth Sci.,spec.
C 2004RAS,GJI,157,1–14 at China University of Geosciences Wuhan Campus on April 27, 2015https://www.doczj.com/doc/4d3510693.html,/ Downloaded from
14F.Jouanne et al.
Mugnier,J.L.,Huyghe,P.,Leturmy,P.&Jouanne,F.,2003.Episodicity and rates of thrust sheet motion in Himalaya(Western Nepal),in Thrust Tectonics and Hydrocarbon Systems,ed.Mc Clay,AAPG Mem.,82,1–24. SPI Publisher Services,Ashland,V A.
Nakata,T.,1989.Active faults of the Himalayas of India and Nepal,Geol. Soc.Am.,spec.,232,243–264.
Nakata,T.,Kumura,K.&Rockwell,T.,1998.First successfull paleoseismic Trench study on active faults in the Himalaya.AGU1998fall meeting, EOS,Trans.Am.geophys.Un.,79,p.45.
Ni,J.&Barazangi,M.,1984.Seismotectonics of the Himalayan Collision Zone:Geometry of the Underthrusting Indian Plate beneath the Himalaya, J.geophys.Res.,89(B2),1147–1163.
Okada,Y.,1985.Surface deformation to shear and tensile faults in a half space,Bull.seism.Soc.Am.,75,1135–1154.
Pandey,M.R.,Tandukar,R.P.,Avouac,J.P.,Lav′e,J.&Massot,J.P.,1995. Evidence for recent interseismic strain accumulation on a mid-crustal ramp in the Central Himalayas of Nepal,Geophys.Res.Lett.,22,751–758.
Pandey,M.R.,Tandukar,R.P.,Avouac,J.P.,Vergne,J.&H′e ritier,Th., 1999.Seismotectonics of the Nepal Himalayas from a local seismic net-work,in Advances on the Geology of the Himalaya,Focus on Nepal, 17,pp.703–712,eds Le Fort,P.&Upreti,B.N.,https://www.doczj.com/doc/4d3510693.html,n Earth Sci., spec.
Paul,J.et al.,2001.The motion and active deformation of India,G.R.L., V ol.28,4,pp.647–650.
Pecher,A.,1991.The contact between the higher Himalayan crystallines and the Tibetan sedimentary series:Miocene large-scale dextral shearing, Tectonics,10,587–598.
Shen,Z.-K.,Zhao,C.,Yin,A.,Li,Y.,Jackson,D.D.,Fang,P.&Dong, D.,2000.Contemporary crustal deformation in east Asia constrained by Global Positioning System measurements,J.geophys.Res.,105,5721–5734.Singh,D.D.,2000.Seismotectonics of the Himalayas and its vicinity from
centroid-moment tensor(CMT)solution of earthquakes,J.Geodyn.,30,
507–537.
Srivastava,P.&G.Mitra,1994.Thrust geometries and deep structure of the
outer and lesser Himalayas,Kumaon of the Himalayan fold-and-thrust
belt;Tectonics,13,89–109.
Upreti,B.N.&Le Fort,P.,1999.Lesser Himalayan Crystalline Nappes
of Nepal:problem of their origin,in Advances on the geology of the
Himalaya,focus on Nepal geology https://www.doczj.com/doc/4d3510693.html,n Earth Sci.,spec.328,225–
238.
Van der Beek,P.A.,Champel,B.,&Mugnier,J.L.,2003.Drainage develop-
ment in regions of active fault-propagation folding controlled by detach-
ment dip,Geology,30,471–474.
Vergne,J.,Cattin,R.&Avouac,J.P.,2001.On the use of dislocation to model
interseismic strain and stress buid-up at intracontinental thrust faults,Geo-
phys.J.Int.,147,155–162.
Wang,Qi.et al.,2001.Present-Day Crustal Deformation in China Con-
strained by Global Positioning System Measurements,Science,294,574–
577.
Wessel,P.&Smith W.H.F.,1998.New improved version of the Generic
Mapping Tools released,EOS Trans.AGU,79,579.
W¨u bbena,G.,1985.Software Developments for Geodetic Positioning with
GPS using TI4100Code and Carrier Measurements,in Proceeding1st International Symposium on Precise Positioning with the Global Posi-
tioning System,V ol.1,pp.403–412,ed.Goad,C.,US Department of Commerce,Rockville,MD.
Y eats,R.&Lillie,R.,1991.Contemporary tectonics of the Himalayan fault
system:folds,blind thrusts and the1905Kangra earthquake,J.Struct.
Geol.,13,215–225.
Zhao,W.,Nelson,K.D.&project INDEPTH Team,1993.Deep seismic
re?ection evidence for continental underthrusting beneath southern Tibet,
Nature,366,555–559.
C 2004RAS,GJI,157,1–14
at China University of Geosciences Wuhan Campus on April 27, 2015https://www.doczj.com/doc/4d3510693.html,/
Downloaded from
激励机制设计的五个原则 建立激励机制必须要研究员工的需求,依照各种激励理论将不同的激励方法加以适当组合。只有对不同的情况区别对待,使用相应的激励手段,才能对企业团队和员工个人实施有效地激励。因此,民营企业要建立良好的人才激励机制,必须遵循物质激励与精神激励相结合、正激励与负激励相结合、长期激励与短期激励相结合、绩效原则、公平原则等基本原则,并且有所侧重,必须想方设法了解并满足员工多元化的个人心理需求,采取多种形式的激励手段,充分激发员工潜能,确保激励机制的合理性和实效性。 一、物质激励与精神激励相结合原则 从管理学上说,激励可分为两类:一类是物质激励,也叫薪酬激励;另一类是精神激励,又叫成长激励。物质激励与精神激励作为激励的两种不同类型,是相辅相承、缺一不可的,只强调物质激励而忽视精神激励或只强调精神激励而忽视物质激励都是片面和错误的。 在实际工作中,一些人总以为有钱才会有干劲,有实惠才能有热情,精神激励是水中月、镜中影,好看却不中用。正是这种片面的理解,致使一部分人斤斤计较、唯利是图,甚至弄虚作假、违法乱纪,给组织环境和社会风气都带来极大危害。另有一些人总爱把大道理挂在嘴边,只讲贡献不讲需要,只讲觉悟不讲利益,以为大家靠喝西北风也能有干劲,这些人恰恰忘了:“思想一旦离开利益,就一定会使自己出丑”。为了避免以上两种片面性的发生,防止“单打”现象的出现,在激励中一定要坚持物质激励与精神激励相结合的方针。 强调物质激励与精神激励相结合,并不是说不需要有所侧重,物质激励与精神激励是对人们物质需要和精神需要的满足,而人们的物质需要和精神需要在层次与程度上受多种因素的制约,并随主客观条件的发展而不断有所变化.从社会角度来看,一般来说,社会经济文化发展水平比较低,人们的物质需求就会比较强烈,而在社会经济文件发展水平比较高的条件下,人们的精神需要则会占主导地位。从个人角度来看,一个人受教育的程度、所从事的工作性质及其自身的品德修养也会对需要产生很大程度的影响。所以,不论从个人发展还是从社会发展
虚拟演播室是视频技术于计算机技术结合的产物,把计算机图形图像处理技术与传统的色键技术集合起来形成的。是一种新颖的独特的电视节目制作技术。 虚拟演播室技术原理:虚拟演播室技术与色键技术十分相像,他是由前景主持人为主的画面和背景画面,采用色键的方法构成一个整体,产生人物置身于背景中的组合画面。 虚拟演播室工作原理 虚拟演播室装修的总体要求: 建立一个功能完善的虚拟演播室,需要做到如下基本要求: 1、要求演播室的拾音空间首先具有较好的语言清晰度、可懂度,其次是要有良好的声音丰满度, 2、要求演播室内各处要有合适的响度和均匀度,具有相应的满足拾音要求的混响频率特性。 3、抑制影响听、拾音音质的声缺陷,防止出现声聚焦、驻波、颤动回声、低频嗡声等。 4、演播室内墙面的声学装饰考虑在装饰大方美观、造型新颖的基础上对于高中低各频段的声学处理方式,特别是低频段的声学处理方式方法。 演播室的建声指标:混响时间≤0.6S±0.05S;噪声评价曲线NR-30---NR-35。 设计的隔声门隔声量大于35dB并具有好的密封性。 5、演播室声学建声装饰所选用的材料符合国家相应的强制消防要求,要求采用达到B1、B2级标准的材料。 6、演播室声学建声装饰所选用的材料符合国家相应的强制环保要求,特别是要求甲醛的释放量为<0。1mg/m3。墙面装饰层内禁止使用不安全和危害性较高的吸声材料。 7、装饰踢脚线兼做视音频线槽并做屏蔽处理。 8、演播室配置录制指示灯和紧急逃生指示灯。 9、装饰层内的综合布线按要求做穿管处理。 10、演播室现有的位置南边部分为玻璃幕墙,不利于演播室的隔声,所以要对原幕墙部分进行隔断,制作隔声封闭处理,在保证整体装饰的美观性和隔声性的同时,还应保证演播室正常的通风换气。 11、导控室地面用防静电地板,装修过程中做好设备布线(强电,弱电),做好防雷,接地各类设施的设计施工。 12、装修预留好空调位置,并配合本台做好空调,配电等设备的安装施工。
促销活动中激励机制如何设置您的激励措施达到了激励目的了吗? 现今,很多商场在做大型促销活动的时候,均设置了动员与激励环节,以期望最大限度地调动活动参与人员的积极性,提高活动的接单量。大量的事实也证明,好的激励方案对活动的成功开展的确起到了积极的作用,值得肯定。但是,也出现了不少“无效激励”的现象,需要进行改良。 问题的关键是激励机制如何制定才能真正实现激发个人或团队斗志,提高团队协同作战能力、营造良好的分享氛围、提高活动接单量等,而不至于出现激励后遗症,这是管理者在制定激励方案时需要仔细斟酌和考量的。 激励措施的分类 激励按性质划分,一般分为正激励与负激励两种;按方式划分,一般分为物质奖励与精神奖励两种;按形式划分,一般分为团队激励与个人激励两种;按周期划分,一般分为短期激励与长期激励两种等等,形式多种多样,在此就不一一赘述。 仔细看了很多商场提交的活动方案,相当一部分的商场在活动期间的激励方案如下: 个人奖励:1—5单以上,奖励20元/单;6—10单以上,奖励30元/单;10—20单以上,奖励45元/单;21—30单以上,奖励60元/单;31—40单以上,奖励80元/单 集体奖励:完成目标180单,奖励集体漂流或旅游一次。 这种做法的好处是简单、易操作,但存在的弊端是过于简单,同时还存在很多漏洞,不一定能达到激励的目的。 制定激励方案 在制定激励方案时,须综合考虑目标可实现性、团队氛围、个人接单能力、活动力度(与自己以往比、与对手比)、活动宣传面、活动开展时间(淡季还是旺季)、以往所采用过的方式方法等因素,同时切忌简单的复制商场的激励方案,否则,就会出现有激励无动力的局面,达不到激励的目的。 总体目标的制定建议分三级设置:确保级(及格线)、力争级(成功线),冲击级(非常成功线),这样的好处是可望又可及。如:保60单、争80单、冲100单,再设置相应的奖励。 团队目标和个人目标的设定上,同样也采用三级别设置,这样的好处是能将总目标分解到具体的每个人,真正实现千斤重担人人挑,人人头上有指标。
VS-VSCENE 虚拟演播室系统方案建议书北京华视恒通系统技术有限公司
北京华视恒通系统技术有限公司 目栩 公司简介................................................................................................................................................................... 3.. . 惊)前悅........................................................................................................................................................................................ 4.. . . 二)系统方案设计.................................................................................................................................................. 4.. . 1、设计原则........................................................................................................................................... 4.. . 2、设计方案........................................................................................................................................... 5.. . 3、系统结构原枞图............................................................................................................................. 7.. . 4、系统功能特点 ................................................................................................................................ 1..0. 5、TOPACK-C抠K 像卡................................................................................................................ 1..2 6、TOPACK-CG/AUD旓IO幕混愃卡 ................................................................................ 1..3 三)软件系统功能................................................................................................................................................. 1..5. 1、系统参数设敢 ................................................................................................................................ 1..5. 2、抠像参数设敢 ................................................................................................................................ 1..7. 3、场景编排.......................................................................................................................................... 1..8. 4、实时控敥.......................................................................................................................................... 2..0. 5、远程旓幕客户端............................................................................................................................ 2..2. 四)设备悪本及效果图........................................................................................................................................ 2..3. 五)系统配敢........................................................................................................................................................................................ 2..4 . 售后服务措施及承诺 ............................................................................................................................................. 2..6.
封面 作者:ZHANGJIAN 仅供个人学习,勿做商业用途
员工激励机制方案 人力资源是现代企业的战略性资源,也是企业发展的最关键的因素,而激励开发是人力资源的重要手段。企业实行激励机制的最根本的目的是正确地诱导员工的工作动机,使他们在实现组织目标的同时实现自身的需要,增加其满意度,从而使他们的积极性和创造性保持和发扬到最佳状态。建立一套科学有效的激励机制直接关系企业的生存和发展。在企业激励机制的创建中,不能忽视人的需要的作用,只有建立以人为本的激励机制,才能使其在企业的生存和发展中发挥巨大的作用。 一、员工的基本需要(本中心的工资激励制度) 激励来源于需要。作为企业的经营者首先应该了解员工除了薪酬和福利待遇等最基本的需要之外还存在着如安全的需要、归属的需要、社会的需要、自我价值实现的需要等多方面的需求。物质需要仅仅是员工基本需要的一个方面。实际上员工的需要是多种多样的,不同的人有不同的需要,员工共同的需要就是企业的需要。人们有了需求才会有动力,当然员工的需求必须是他经过努力后才能达到的,这样才能起到激励的作用。因此,建立合理有效的激励机制,就必须根据员工的需要对激励的目标和方法进行具体的研究,采取多方面的激励途径和方法与之相适应,在“以人为本”的员工管理模式基础上建立企业的激励机制。从本中心的激励模式来分析,员工的满意度达不到理想的程度,难以留住人才。 二、激励的基本方式 一般来说,根据需求的不同,可将激励分为四大类;成就激励、能力激励、环境激励和物质激励。 (一)成就激励 近代著名管理学家麦克利兰明确的将人在基本需求(生理一安全)之上的部分分为社会交往——权力欲望——成就欲望等三个不同的层次。在人的需求层次中,成就需要是人的一个相对较多的需求层次。成就激励的基本出发点是随着社会的发展、人们的生活水平逐渐提高,越来越多的人在选择工作时不仅仅是为了生存,更多的是为了获得一种成就感,从实际意义上来说,成就激励是员工激励
思考:如何设计一个组织的激励制度? 什么是激励?美国管理学家贝雷尔森(Berelson)和斯坦尼尔(Steiner)给激励下了如下定义:“一切内心要争取的条件、希望、愿望、动力都构成了对人的激励。——它是人类活动的一种内心状态。”人的一切行动都是由某种动机引起的,动机是一种精神状态,它对人的行动起激发、推动、加强的作用。 如何在工作上调动员工的积极性,激发全体员工的创造力,是开发人力资源的最高层次目标。作为企业,需要塑造激发员工创造力的环境和机制:一是创造一个鼓励员工开拓创新精神和冒险精神的宽松环境以及思想活跃和倡导自由探索的氛围;二是建立正确的评价和激励机制,重奖重用有突出业绩的开拓创新者;三是强化企业内的竞争机制,激励人们去研究新动向、新问题,并明确规定适应时代要求的技术创新和管理创新的具体目标;四是要求企业必须组织员工不断学习以更新知识,并好好的引导他们面对现实去研究技术的新动向。同时做到在员工心里,使他们知道工作行为的实际效果,产生员工高效工作、高满足的结果。 对于激励的方式现在学术界有很多种理论和方法,有著名的马斯洛需求层次理论、激励—保健双因素理论,其中激励因素为满意因素,有了它便会得到满意和激励。保健因素为不满意因素,没有它会产生意见和消极行为。其实诸多模式中都不外乎两个方式:正面激励与反面激励。 对此我们可以从上述两个方面入手建立一个适合、有效的激励模式。 薪酬层面: 企业的人力资源管理系统中,薪酬问题无疑是最为敏感的问题之一。长期以来,分配制度上存在的问题一直困扰着众多企业管理系统运行效率与效果。目前,众多国内企业分配制度上都不同程度地存在两个问题,一是分配中的平均主义,这在国企尤为突出;二是薪资支付的随机性,这是众多民营企业的通病。我在公司实践调查中发现,公司老总总是热衷于绩效管理系统的建设,而不愿意对薪酬系统进行相应的变革。他们的理由很简单:进行薪酬系统变革可能对企业绩效没有直接的影响,况且一旦变革,也许就得加工资,这是多数老板们不情愿看到的,因此也就不会搞这个既发精力又增加人力成本的事。所以在激励员工方面是没有到位的。 从总体管理流程来看,薪酬管理属于企业人力资源管理的一个末端环节,特别是在企业最底层的员工,对于他们这个薪酬的激励作用可以说是整个企业中最大的。前面已提到他们大多是从经济水平低的农村来的,所以物质的满足即是他们工作最重要的目的了。针对员工我们可以采用以下方法建立薪酬机制: 其一是废除官僚的行政级别制度建立以市场为导向的薪酬机制 在薪酬制度上企业一般采用行政级别制,在这种制度下员工的发展是极为单向的,要想多赚钱只有“熬”级别,通过对制造企业的岗位分析,其车间员工占一个相当大的比例,余下的或做技术的员工,或做销售的员工,他们不可能都安排担任行政的级别,在这种现状下,上至高层领导、中至车间领导、下至基层员工,三者继续倚老卖老、抱残守缺、继续维系个人利益、裙带利益和派系利益。要想清除这种不良的现象,必须废除官僚的行政级别制建立以市场为导向的薪酬机制,在这种机制下,薪酬不再以行政级别为标准,而是以员工对企业
建立健全激励机制深化国有企业改革(上) ——四川建立健全国企经营管理者激励机制的探索与启示随着改革的深入,四川省委、省政府进一步认识到:国企要摆脱困境,必须建立起一套符合社会主义市场经济要求的企业制度、管理体制和管理模式。在建立现代企业制度进程中,由于出资者缺位等国情特点,搞活国有企业更有赖于高素质的企业经营管理者,尤其是高素质的职业企业家阶层。而要调动他们的积极性和创造性,必须要有一套适应社会主义市场经济体制要求的激励约束机制。由于四川省委、省政府高度重视,大胆改革,使四川国企经营管理者激励机制的探索建立有较大突破,取得了实质性进展。 一、四川探索国有企业经营管理者激励机制的作法及成效 (一)四川对国企经营管理者的主要激励方式 1、物质激励 四川采取的物质激励形式,归纳起来,主要有六种: (1)业绩计提 报酬结构:基薪+业绩计提 对省属公司制企业的董事长、总经理或非公司制企业的厂长(经理)主要采用这种激励形式,部分市、县也参照这种形式制定国企经营管理者的报酬方案。其基薪主要根据企业规模、本地区和本企业职工平均工资收入水平确定,其公式为: 基薪=(本企业职工上年度平均工资+本地区职工上年度平均工资)÷2×系数 公式中“系数”根据企业资产规模等具体情况,确定在2.0-10.0的范围内。业绩计提以基薪为基础,根据其经营实绩确定。赢利企业、亏损企业的考核指标及计算办法有所区别。赢利企业主要考核指标为净资产增值率、净资产收益率和社会贡献率:净资产增值率每增加1%,按基薪的15%计提业绩收入;净资产收益率每增加1%,按基薪的10%计提业绩收入;社会贡献率每增加1%,按基薪的6%计提业绩收入。亏损企业经营管理者业绩收入主要按减亏增盈指标考核,实行分档递减计提的办法,按减亏额的1-2%计提业绩收入。税收指标是计提业绩收入的否定指标,亏损企业的社会贡献率指标也是计提业绩收入的否定指标。各项考核指标基数原则上以上年实际完成数为基础并参考行业和区域内经济效益水平合理确定,考核指标基数一年一定。同时建立国企经营管理者专用帐户,将其业绩收入的50%存入专户,作为经营管理者任期风险保证金,用于抵补经营管理者以后年度可能形成的亏损。经营管理者调动、解聘或退休时,经离任审计一年后,方能兑现余额。 (2)奖售股权 报酬结构:基薪+股权或股票期权等 对股份制企业,尤其是上市公司的总经理或董事长采用这种激励形式,其他领导班子成员按照小于1的系数进行折算,通过给予不同数量的股权、股票期权来体现其差别。奖售股权分四种情况:一是奖励股。有些市专门设了两种形式的奖励股份:一种是将经营管理者年薪中的部分奖金折算成普通股份;另一种是凡任期内经济效益连续3年上升及做出其他突出贡献的,按企业净资产的含量折算为股份予以奖励。二是出资购买和送配股。长虹集团改制时,要求经营管理人员购买股份,根据职位和工龄,最多8000多股,最少3000多股。其中董事长兼总经理期初持股7900股,逐年送配后现在达65227股。在任期间,这些股票均被“锁定”,不能出售。三是岗位股。南充、眉山等地在国企股份制改造时,对总经理设岗位股,经理班子其他成员按经理的0.5-0.8比例设置。这种岗位股实际上是一种干股,只享有红利分配权。四是股票期权和分配权期权,目前四川正在积极探索试行这种激励方式。 (3)目标定酬 报酬结构:A目标薪金+B目标薪金等 这种形式没有基薪。对国有宾馆、饭店、旅游公司以及部分商贸企业,尤其是特殊困难亟待解决的企业总经理或兼职董事长一般采用这种激励形式。1999年,绵阳药业集团外聘一位营销部经理,年薪28万元(没有基薪),交30万元股金并作为风险抵押金,确定销售、利润两项目标:完成销售目标任务3200万元,领取销售部分底薪8万元;完成利润目标400万元,领取利润部分底薪20万元。实现销售的超差部分则按同比例增减销售底薪(增加销售薪金的前提是必须完成利润指标)。利润指标完成额未达到400万元,则按比例扣减利润底薪,利润低于274万元,则按未完成额的26.8%扣减收入和风险金;利润超出400万元的部分则按所得税后剩余部分的40%提成,年总收入的25%留在公司作为本人风险抵押金。目标定酬的激励约束作用很大,1-9月,该营销部实现利润470万元,是上年同期利润的8倍,净资产收益率已达71.2%。 (4)准公务员报酬 报酬结构:工资+津贴、奖金等 对承担政策目标的水、电、气、电信、邮政及对国民经济和国家安全具有特殊战略意义的大型集团
虚拟演播室技术说明 由于虚拟演播室系统不同于传统演播室的抠像,它允许几台摄象机在不同的角度分做推、拉、摇、移等动作。为了保证摄象机在蓝箱中拍摄的人物与计算机制作的虚拟场景通过色键组合成系统准确合成,要求虚拟演播室系统中人物的活动空间(蓝箱)要有非常均匀和柔和的照明,不能有硬的影子出现,所以首先应用柔光灯把蓝箱铺满打匀,形成一个基本光。 根据贵台的实际情况,设计方案如下: 1.篮箱立面墙的布光:在灯具的选择上,虽然近年来国内一些灯 光企业相继推出了虚拟演播室专用灯光设备,但是由于大多数 电视台虚拟演播室是在原有传统演播室中设置的,所以虚拟演 播室的布光可利用传统演播室的灯具进行布光。布光时,我们 首先考虑选用冷光源——4×55W三基色柔光灯9台,由于它是 散射型光源,布光面积大,容易将墙体的光布匀。 2.篮箱地面布光:在虚拟演播室节目制作时,画面如果出人物的 全景,出现虚拟的地面时,这时不但主持人身后和两侧的蓝墙 要有均匀的布光,而且蓝箱的地面也要有非常均匀的照明。本 方案我们采用4×55W三基色柔光灯6台,作为地面布光,使 篮箱地面光线均匀; 3.人物布光:虚拟演播室人物的布光基本方法和对光比的要求, 仍采用传统演播室的三点式布光和对光比的要求,但同时要考 虑到虚拟演播室的特点。灯光人员在布光前要使人物的主光方
向与虚拟场景中的主光方向一致,同时使光的强弱、硬柔、色彩也都要与虚拟场景中的主光方向一致。使人和景在画面上融为一体,看起来真实。方案采用冷热光源混合式布光,用2台6×55W三基色柔光灯作为侧光,4×55W、6×55W三基色柔光灯各2台,1KW透射式聚光灯2台,作为人物的主面光和辅助面光,使拍摄人物更加丰满圆润; 4.吊挂系统采用格珊架式悬挂,充分利用室内空间高度,避免拍 摄全景时发生“穿帮”现象; 5.整个虚拟演播室采用冷热混合光源布光,总功率为9KW、色温 3200k、中心照度900Lux,满足贵台的虚拟演播室拍摄需求。
SUNUR-VS三维虚拟演播室系统集成方案 一、系统综述 如何在有限的时间内,不用花费大量的精力和财力,就能轻松地搭建出富有创意的演播室,制作出精彩新颖又充满无限魅力的节目?如何在现有的标清环境下选择面向未来的高清系统而不浪费投资?福州索普电子科技有限公司推出的面向未来创新虚拟演播室系统——SUNUR-VS,一个先进的、实用的、高度集成的、真三维、全场景的虚拟演播室完整解决方案,可以轻而易举地让您的梦想成真。 SUNUR VS三维虚拟场景解决方案使虚拟演播室系统去除了烦琐的硬件配置和大规模的数据运算,凭借简单的设置和直观的用户界面,使之成为一套功能强大的广播电视节目制作工具。只要利用摄影棚中的一小部分空间搭配绿色或蓝色背景,加上摄影灯光,把人物拍下,通过系统集成的色键器,对摄像机获得的信号与虚拟演播室系统信号进行处理,即可实现演播主体与虚拟场景的合成。从此,不再受狭小空间和景物的限制,使用SUNUR VS三维虚拟演播室系统,充分发挥您的想象力和创造力,便可满足任何电视节目现场直播、后期制作及应用的需要。并且,SUNUR VS 无三维虚拟演播室系统具有颠覆传统的业界最优的性价比。通过极快速的启动时间和极低的成本,SUNUR VS三维虚拟演播室系统能为新闻电视广播、体育、财经、现场访谈、气象、远程教育、娱乐节目、广告、游戏秀以及许多其他应用领域提供理想的硬件和软件解决方案。 二、系统方案设计原则 随着电视业和计算机技术的极速发展,高清制作和播出的要求也离我们越来越
近,虚拟演播室的更新步伐不断加快,大家对节目的制作水平和信号质量要求不断提高,SUNUR VS三维虚拟演播室系统本着"简捷至上"的设计宗旨,充分体现系统的技术先进性、功能完整性、经济实用性、运行可靠性、操作灵活性及系统扩展性,不仅能满足现阶段的需要,同时确保系统在今后相当长一段时间内具有先进性并留有扩展余地。在设计方案的过程中,首先考虑到系统要满足演播室现行技术要求,及其应用领域,同时又符合当今虚拟化的趋势,我们遵循以下几个原则: 1、技术的先进性 SUNUR VS三维虚拟演播室系统是福州索普公司在国外虚拟现实软件的基础上开发而来的真三维虚拟演播室系统,该系统是针对市场反馈,专为广电和电教系统应用量身定做和特别优化设计。 SUNUR VS三维虚拟演播室系统,采用革命性的独特设计,无需传感器,采用独有的虚拟摄像机结构,使得产品的安装、初始调试、使用极其方便,省却了繁琐的安装调试过程,真正作到随架随用,一开就用,迅速快捷。一人即可实现多机位的节目演播操作工作,并且真实人像与实时渲染的三维虚拟背景同步运行。如果用户习惯使用传感器系统时可通过增加传感器实现传统虚拟演播室功能。 SUNUR VS三维虚拟演播室系统一开始设计就采用HDSDI高清输入,并能兼容标清输入。在用户预算可能的情况下可以直接使用高清设备,并实现高清、标清、N制、P制混合输入。并在此基础上开发出基于模拟及HDMI接口输入的配套产品,以满足不同经济条件的用户的不同个性化需求。 2、功能完整性 SUNUR VS三维虚拟演播室系统功能完善。 系统集成了色键器、切换台等多种功能。 您无需使用昂贵的摄像机动作传感器,系统采用独有的虚拟摄像机结构。能够轻松的在3D场景中设置和改变8个不同的虚拟摄像机位置(模拟配置),还可方便地编辑3D场景中摄像机的运动速度和运动轨迹。通过与3D虚拟场景进行实时地无缝结合,可进行多重虚拟摄像机的显示与切换。 在系统配置的动作设计模块中,可以生成实时的镜像反射效果,增强了场景的真实感。
激励机制的设计 所谓激励机制的设计是指组织为实现其目标,根据其成员的个人需要,制定适当的行为规范和分配制度,以实现人力资源的最优配置,达到组织利益和个人利益的一致。 激励机制的设计的实质是要求管理者抱着人性的观念,通过理性化的制度来规范员工的行为,调动员工的工作积极性,谋求管理的人性化和制度化之间的平衡,以达到有序管理和有效管理。这正是管理者孜孜以求的。 激励机制设计包括以下几个方面的内容: 第一,激励机制设计的出发点是满足员工个人需要。设计各种各样的外在行奖酬形式,并设计具有激励特性的工作,从而形成一个诱导因素集合,以满足员工个人的外在性需要和内在性需要。 第二,激励机制的直接目的是为了调动员工的积极性。其最终目的是为了实现组织目标, 谋求组织利益和个人利益的一致,因此要一个组织目标体系来指引个人的努力方向。 第三,激励机制的设计的核心是分配制度和行为规范。分配制度将诱导因素集合与目标体系连接起来,即达到特定的组织目标将会得到相应的奖酬。行为规范将员工的性格、能力、素质等个性因素与组织目标体系连接起来。行为规范规定了个人以一定的行为方式来达到一定的目标。 第四,激励机制设计的效率标准是使激励机制的运行富有效率。效率准则要求在费用相同的两个备选方案当中,选择目标实现程度较好的一个方案;在目标实现程度相同的两个方案中,选用费用较低的一个方案。而决定机制运行成本的是机制运行所需的信息。信息沟通贯穿于激励机制运行的始末,特别是组织在构造诱导因素集合时,对员工个人真实需要的了解,必须充分进行信息沟通。通过信息沟通,将个人需要与诱导因素连接起来。随着信息技术在企业中的广泛运用,可以大大降低激励机制运行过程中很多环节的信息处理成本。但是,连接诱导因素集合与个人需要之间的信息沟通是无法省略的。 第五,激励机制运行的最佳效果是在较低成本的条件下达到激励相容,即同时实现了员工个人目标和组织目标,使员工个人利益组织利益达到一致。 激励机制设计模型如下图
VR虚拟演播室系统建设方案Make your dream magic ,make your life magic
目录 1.建设背景 (3) 2.设计原则 (4) 3.需求分析 (8) 4.VR情景互动虚拟演播室系统 (10) 方案概述 (10) 系统拓扑图 (11) 核心设备及功能 (11) VStage情景互动虚拟演播室系统 (11) 摄像采集设备 (25) 快速编辑模块 (25) 5.方案优势 (30) 6.售后服务与技术支持 (33) VR虚拟演播室系统建设方案
1.建设背景 虚拟演播室系统(The Virtual Studio System,简称VSS)是近年发展起来的一种独特的电视节目制作技术。它的实质是将计算机制作的虚拟三维场景与摄像机现场拍摄的人物活动图像进行数字化的实时合成,使人物与虚拟背景能够同步变化,从而实现两者天衣无缝的融合,以获得完美的合成画面。采用虚拟演播室技术,可以制作出任何想象中的布景和道具。无论是静态的,还是动态的,无论是现实存在的,还是虚拟的。这只依赖于设计者的想象力和三维软件设计者的水平。许多真实演播室无法实现的效果,对于虚拟演播室来说,却是“小菜一碟”。 从跟踪方式的区分,虚拟演播室分为有轨虚拟演播室和无轨虚拟演播室。有轨跟踪虚拟演播室系统应用摄像机跟踪技术,获得真实摄像机数据,并与计算机生成的背景结合在一起,背景成像依据的是真实的摄像机拍摄所得到的镜头参数,因而和主持人的三维透视关系完全一致,避免了不真实、不自然的感觉。虚拟演播室的跟踪技术有4种方式可以实现,网格跟踪技术、传感器跟踪技术、红外跟踪技术、超声波跟踪技术,其基本原理都是采用图形或者机械的方法,获得摄像机的参数,包括摄像机的X、Y、Z、(位置参数)Pan、Till、(云台参数)Zoom、Focus(镜头参数)由于每一帧虚拟背景只有20ms的绘制时间,所以要求图形工作站实时渲染能力非常强大,对摄像机的运动没有更多的限制,一般适合专业电视台,对节目制作要求较高的用户使用。但调试非常复杂,耗时长,需要专业人士才能操控。无轨虚拟演播室相对比较简单,它是预生成三维背景,即首先要制作好背景的三维模型,然后预先定义好虚拟摄像机的机位和镜头参数,根据这些数据生成每台虚拟摄像机的视图画面,最
绩效激励管理方法 1 目标设置法 1.运用须知 目标设置指的是在特定时间内,按数量或质量标准对需要实现的结果所进行的陈述。一般来说,目标的设置依据来源于公司的战略目标、部门目标、所在岗位的工作职责、内部或外部的客户需求等。 2.运用程序分析 目标设置法的运用程序包含组织目标的设置、组织目标的分解、部门目标的设置、部门目标的分解和个人目标的设置五个阶段。 (1)组织目标的设置 组织目标的设定是目标设定的起点,各部门和个人的目标设定与分解都是在组织目标的基础上进行的,组织目标的设置程序如下。 ①进行环境分析。组织所处的环境,包括组织所处的宏观环境、中观环境及微观环境。公司在制定战略目标时必须对公司内外部的环境进行充分的分析。 宏观环境的分析主要包括政治法律环境、经济环境、社会文化环境及技术环境,常用工具是PEST(Policy、Economic、Society、Tecnology)模型。具体分析内容如下表所示。 宏观环境分析 中观环境分析即分析组织所处的产业环境,常用工具是波特的五力模型。具
体分析内容如下图所示。 中观环境分析 微观环境的分析即对企业自身的条件进行分析,常用工具是SWOT 分析方法。根据SWOT 分析方法,组织战略目标设定的微观环境分析具体如下表所示。 微观环境分析 优势(S ) 劣势(W ) 1.擅长什么 2.组织有什么新技术 3.能做什么别人做不到的 4.和别人有什么不同 5.顾客为什么来…… 1.什么做不来 2.缺乏什么技术 3.别人有什么比我们好 4.不能够满足何种顾客 5.最近因何失败…… 供应商的议价能力 供方主要通过其提高投入要素价格与降低单位价值质量的能力,来影响行业中现有企业的盈利能力与产品竞争 购买者的议价能力 购买者主要通过其压价与要求提供较高的产品或服务质量的能力,来影响行业中现有企业的盈利能力 替代品的威胁 替代品价格越低、质量越好、用户转换成本越低,其所能产生的竞争压力就强;而这种来自替代品生产者的竞争压力的强度,可以具体通过考察替代品销售增长率、替代品厂家生产能力与盈利扩张情况来加以描述 新进入者的威胁 新企业进入一个行业的可能性大小,取决于进入者主观估计进入所能带来的潜在利益、所需花费的代价与所要承担的风险这三者的相对大小情况。新进入者的威胁程度取决于进入新领域的障碍大小与预期现有企业对于进入者的反应情况 行业竞争者的竞争 行业中的企业的利益都是紧密联系的,各企业竞争战略的目的是使自己的企业获得更加优越的优势,这些构成了 行业竞争者的竞争
SUNUR-VS虚拟演播室界面说明导入场景 1、点击导入场景按钮,选择D盘下所要应用的场景; 2、场景载入。
场景管理 视频:点击视频,显示select live and mic操作界面,选择视频decklink video capture(2),选择音频decklink audio capture(2),选择select完成,选择1280*720 50帧(与来自摄像机信号相匹配),出现来自摄像机信号。
文件:点击文件,选择来自计算机的视频文件,导入完成。 物体:物体是对视频活文件的一个赋予(可以将文件或视频赋予给大屏或主持人) 物体控制:点击此按钮,可对主持人、LOGO或物体,对其进行大小、位置进行改变。 隐藏:对当前选中的对象进行隐藏和显示操作。(一般当前操作的对象会在下方显示) 定向、跟随:在被选对象的旋转操作时,进行定向或跟随操作(建议一般在旋转场景时不要使用跟随)。 16:9:点击按钮,进行4:3和16:9的切换。 抠像设置 应用抠像:对当前对象进行抠像操作应用。
取消抠像:对当前对象取消抠像操作应用。 网格背景:对当前所选对象进行网格背景和黑色背景的切换。黑色背景:对当前所选对象进行网格背景和黑色背景的切换。ALPHA:对所选视频进行alpha通道的抠像。(使要被保留的对象全部变成白色,要去掉的对象全部变成黑色。即黑透白不透)COLOR:对所选视频进行彩色通道的抠像。 黑色通道:对所选视频进行黑色通道抠像的参数调整(不要的对象如背景通过此按钮全部调成黑色) 白色通道:对所选视频进行白色通道抠像的参数调整(要保留的对象如主持人通过此按钮全部调成白色) 边缘色溢:对所选视频进行色溢参数调整(其实是对住要扣的对象进行实际色彩的调整,类似于条白平衡)。 色阀调节:对所选视频进行色阀参数调整(可以理解为对一开始的取色进行色彩饱和度的调整)。另外通过此按钮和白色通道的调整可对要抠对象的边缘进行更加完美的调整。 上边裁边:对所选视频进行上裁边操作。 下边裁边:对所选视频进行下裁边操作。 左边裁边:对所选视频进行左裁边操作。 右边裁边:对所选视频进行右裁边操作。 人物反射:对人物在地面上的反射进行参数调整。 地面反射:对虚拟背景进行在地面上反射参数的调整。
激励机制设计的五个原 则 Document number:PBGCG-0857-BTDO-0089-PTT1998
激励机制设计的五个原则 建立激励机制必须要研究员工的需求,依照各种激励理论将不同的激励方法加以适当组合。只有对不同的情况区别对待,使用相应的激励手段,才能对企业团队和员工个人实施有效地激励。因此,民营企业要建立良好的人才激励机制,必须遵循物质激励与精神激励相结合、正激励与负激励相结合、长期激励与短期激励相结合、绩效原则、公平原则等基本原则,并且有所侧重,必须想方设法了解并满足员工多元化的个人心理需求,采取多种形式的激励手段,充分激发员工潜能,确保激励机制的合理性和实效性。 一、物质激励与精神激励相结合原则 从管理学上说,激励可分为两类:一类是物质激励,也叫薪酬激励;另一类是精神激励,又叫成长激励。物质激励与精神激励作为激励的两种不同类型,是相辅相承、缺一不可的,只强调物质激励而忽视精神激励或只强调精神激励而忽视物质激励都是片面和错误的。 在实际工作中,一些人总以为有钱才会有干劲,有实惠才能有热情,精神激励是水中月、镜中影,好看却不中用。正是这种片面的理解,致使一部分人斤斤计较、唯利是图,甚至弄虚作假、违法乱纪,给组织环境和社会风气都带来极大危害。另有一些人总爱把大道理挂在嘴边,只讲贡献不讲需要,只讲觉悟不讲利益,以为大家靠喝西北风也能有干劲,这些人恰恰忘了:“思想一旦离开利益,就一定会使自己出丑”。为了避免以上两种片面性的发生,防止“单打”现象的出现,在激励中一定要坚持物质激励与精神激励相结合的方针。
强调物质激励与精神激励相结合,并不是说不需要有所侧重,物质激励与精神激励是对人们物质需要和精神需要的满足,而人们的物质需要和精神需要在层次与程度上受多种因素的制约,并随主客观条件的发展而不断有所变化.从社会角度来看,一般来说,社会经济文化发展水平比较低,人们的物质需求就会比较强烈,而在社会经济文件发展水平比较高的条件下,人们的精神需要则会占主导地位。从个人角度来看,一个人受教育的程度、所从事的工作性质及其自身的品德修养也会对需要产生很大程度的影响。所以,不论从个人发展还是从社会发展角度来看,精神激励应该逐渐占据主导地位,人的追求将被引向更高的精神。 所以,只有坚持物质激励和精神激励相结合的原则,才能更好地管理企业,更好地调动员工的积极性,这样企业才能够按着自己的计划顺利的发展下去。 二、正激励与负激励相结合原则 说到激励,很多人都会很自然地认为激励就是给员工加薪、升职、搞好福利等等,其实,激励还包括两个方面的,那就是正激励和负激励。 正激励是从正方向予以鼓励,如发放工资、奖金、津贴、福利等;负激励是从反方向予以刺激,如罚款、扣奖金、减薪等,它们是激励中不可缺少的两个方面。俗话说:“小功不奖则大功不立,小过不戒则大过必生”讲的就是这个道理。在实际工作中,只有做到奖功罚过、奖优罚劣、奖勤罚徽,才能使先进受到奖励、后进受到鞭策,真正调动起人们的工作热情,形成人人争先的竞争局面。如果良莠不分、是非不明,势必造成“干多干少一个样、干与不干一个样”
新媒体公司机构设置薪 酬方案及激励机制 Document number【SA80SAB-SAA9SYT-SAATC-SA6UT-SA18】
公司机构设置及薪酬方案 为了充分调动公司员工的积极性,增强公司的凝聚力,体现“责、权、利”一致的原则,特拟定该机构设置和薪酬方案:一、公司机构设置 公司拟设置行政部、技术部、编辑部和市场部四个部门。 其中公司设总经理、副总经理两个高管职位,工作职责由董事会决定后授权;行政部下设行政总监等4个岗位,主要负责公司的后勤保障、综合文秘、会务安排、财务管理、人力资源等事务;技术部下设技术总监等5个岗位,主要负责公司“两微一端”及频道技术维护、产品设计和开发、交互设计、运维测试、网络安全等事务;编辑部下设内容总监等3个岗位,主要负责公司“两微一端”及频道内容生产、信息更新、稿件编审、话题策划及版面维护等事务;市场部下设市场总监、频道总监等4个岗位,主要负责频道和项目运营、社群管理、活动策划、项目执行等事务。 二、公司岗位薪酬方案 (一)公司高管及中干 总经理:全面主持公司内容和运营工作。 薪酬:月薪万,根据董事会考核发放年终奖 副总经理:协助总经理以及分管相关工作。 薪酬:底薪万加提成(提成办法见附件),年底公司根据业绩考核发放年终奖。
技术总监:对公司新媒体产品进行研发、设计、制作。 薪酬:年薪20-30万,基本年薪为年薪的70%,余下部分公司考核后发放全额或者部分。 市场总监:带领运营团队全面开展公司的运营工作。 薪酬:底薪分别为1万、万加提成,年底公司根据业绩发放年终奖。 频道总监:带领社群运营团队开展公司的社群运营工作。 薪酬:底薪分别为1万、万加提成,年底公司根据业绩发放年终奖。 内容总监:带领内容团队对公司的两微一端进行内容建设工作。薪酬:底薪分别为1万、万,年底公司根据业绩发放年终奖。 行政总监:统筹管理公司政务、事务、安全保卫、内部服务与对外联络工作。 薪酬:底薪分别为万、1万,年底公司根据业绩发放年终奖。 财务总监:在董事会和总经理的领导下,总管公司会计、报表、公司预算体系建立、经营计划、预算编制、执行与控制工作。薪酬:底薪分别为1万、万,年底公司根据业绩发放年终奖。(二)部门岗位 1、技术部 技术人员:(助理工程师、工程师、高级工程师、首席工程师)
激励机制设计 (一)激励机制的含义 激励机制的含义是由激励和机制两个含义的有机合成。所谓机制,是指系统内各子系统,各要素之间相互作用、相互联系、相互制约的形式和运动原理以及内在的、本质的工作方式。它包含下几层含义:①机制按照一定的规律自动发生作用并导致一定的结果。②机制不是最终结果,也不是起始原因,它是把期望转化为行动、原因转化为结果的中介。③机制制约并决定着某一事物功能的发挥。 ④在一定的系统中,机制是客观存在的,它所反映的是事物内在的、本质的作用方式和规律,是系统各组成部分之间相互作用的动态关系。⑤机制的优劣是以其作用于系统而导致的系统机能的强弱来评价的。这样,我们就可以把激励机制定义为:在组织系统中,激励主体与激励客体之间通过激励因素相互作用的方式。 (二)激励机制的内容 根据激励的定义,激励机制应包括五个方面的内容。 ⒈诱导因素集合 诱导因素就是用于调动员工积极性的各种奖酬资源。 ⒉行为导向制度 它是组织对其员工所期望的努力方向、行为方式和应遵循的价值观的规定。 ⒊行为幅度制度 它是指对由诱导因素所激发的行为在强度方面的控制规则。通过行为幅度制度,可以将个人的努力水平调整在一定范围之内,以防止一定奖酬对员工的激励效率的快速下降。 ⒋行为时空制度 它是指奖酬制度在时间和空间方面的规定。这方面的规定包括特定的外在性奖酬与特定的绩效相关联的时间限制,员工与一定的工作相结合的时间限制,以及有效行为的空间范围。这样的规定可以防止员工的短期行为和地理无限性,从而使所期望的行为具有一定的持续性,并在一定的时期和空间范围内发生。 ⒌行为归化制度 行为归化是指对成员进行组织同化和对违反行为规范或达不到要求的处罚和教育。组织同化实质上是组织成员不断学习的过程,对组织具有十分重要的意