
KONKA GROUP CO., LTD.
THE FIRST QUARTERLY REPORT 2010
§1. Important Notice
1.1 The Board of Directors, the Supervisory Committee, directors,
supervisors and senior executives of Konka Group Co., Ltd. (hereinafter referred to as “the Company”) hereby guarantee that this report carries no false information, misleading statements or major omissions, and will accept, individually and collectively, the responsibility for factuality, accuracy and completeness of the information set forth herein.
1.2 The Financial Report of this first quarterly report has not been
audited by a CPA firm.
1.3 Mr. Hou Songrong (Chairman of the Board of the Company), Mr. Yang Rong
(Chief Financial Officer of the Company) and Mr. Ruan Renzong (Person-in-charge of the accounting agency and the accounting project) hereby confirm that the Financial Report enclosed in this quarterly report is factual and complete.
§2. Company Profile
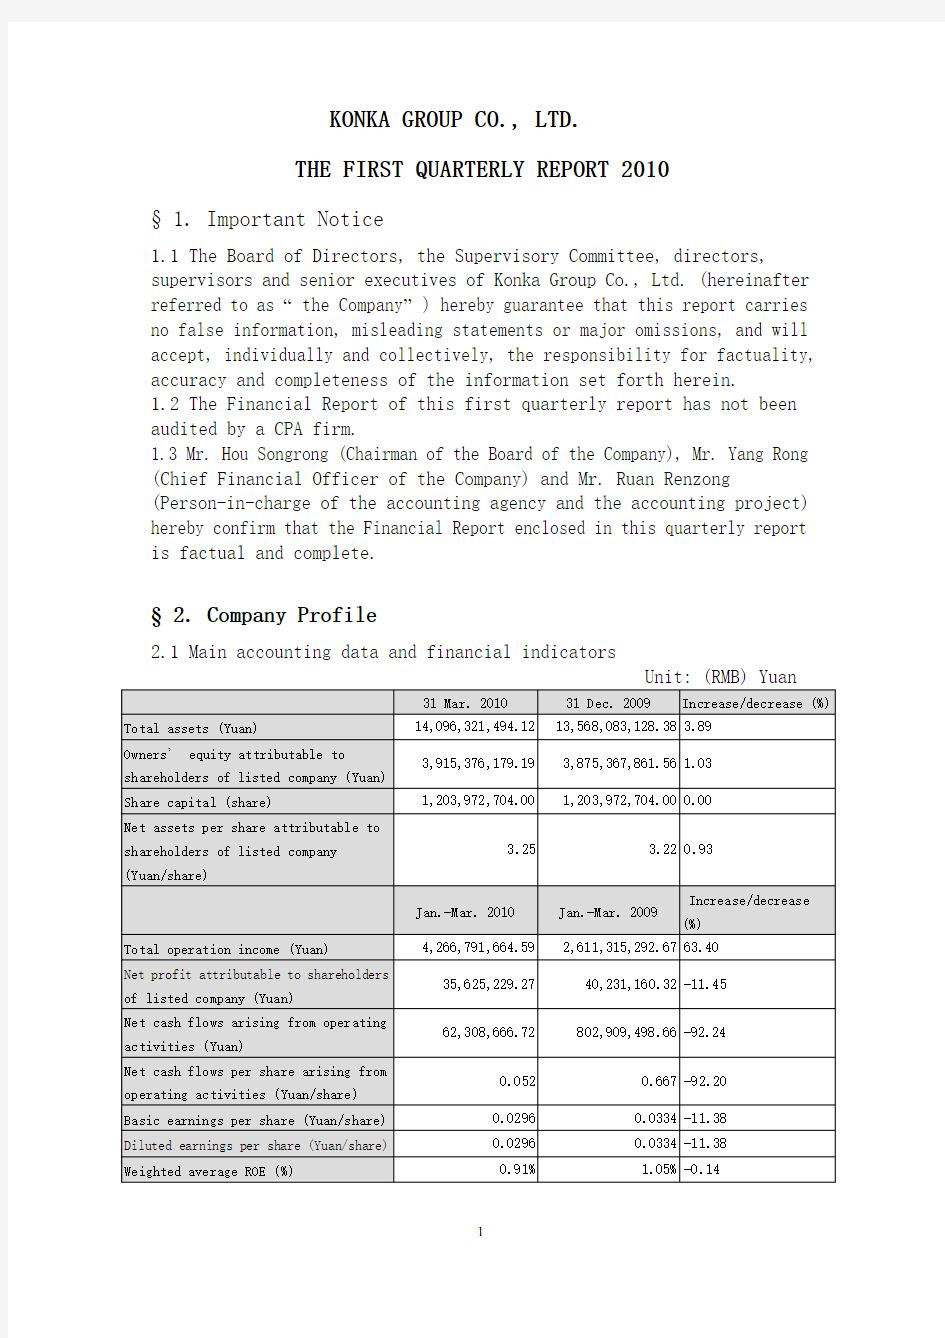
2.1 Main accounting data and financial indicators
Unit: (RMB) Yuan
31 Mar. 2010 31 Dec. 2009 Increase/decrease (%) Total assets (Yuan) 14,096,321,494.1213,568,083,128.38 3.89 Owners’ equity attributable to
shareholders of listed company (Yuan)
3,915,376,179.193,875,367,861.56 1.03 Share capital (share) 1,203,972,704.001,203,972,704.00 0.00 Net assets per share attributable to
shareholders of listed company
(Yuan/share)
3.25 3.22 0.93
Jan.-Mar. 2010 Jan.-Mar. 2009 Increase/decrease (%)
Total operation income (Yuan) 4,266,791,664.592,611,315,292.67 63.40 Net profit attributable to shareholders
of listed company (Yuan)
35,625,229.2740,231,160.32 -11.45 Net cash flows arising from operating
activities (Yuan)
62,308,666.72802,909,498.66 -92.24 Net cash flows per share arising from
operating activities (Yuan/share)
0.0520.667 -92.20 Basic earnings per share (Yuan/share) 0.02960.0334 -11.38 Diluted earnings per share (Yuan/share) 0.02960.0334 -11.38 Weighted average ROE (%) 0.91% 1.05% -0.14
Weighted average ROE after deducting
non-recurring gains and losses (%)
0.62% 1.00% -0.38
Items of non-recurring gains and losses Amount from year-begin to period-end
Gains from disposal of non-current assets 11,426,375.45 Gains and losses from fair value changes in transactional financial assets and
liabilities held by the Company, as well as investment gains from disposing
transactional financial assets and liabilities and financial assets available for
sale, except for the effective hedging business related to the Company’s normal
operation
995,859.35
Other non-business incomes and expenses except for items above 1,873,254.40 Effect on income tax -2,964,813.24 Effect on minority interests -40,432.66
Total 11,290,243.30 Explanation on important items of non-recurring gains and losses:
The gains from disposal of non-current assets listed under the items of non-recurring gains and losses came from the disposal of fixed assets.
2.2 Total number of shareholders at period-end and shareholding of top
ten shareholders holding shares not subject to trading moratorium
Unit: Share
Total number of shareholders at
period-end
93,054 Tradable shares held by top ten shareholders holding shares not subject to trading moratorium
Name of shareholder (full name)
Number of tradable shares not
subject to trading moratorium held
at period-end
Type of share
HOLY TIME GROUP LIMITED 43,597,200Domestically listed foreign
shares
China Construction Bank—China Advantage
Growth Stock Fund
38,084,907RMB ordinary shares Overseas Chinese Town Group Corporation 30,372,843RMB ordinary shares
GAOLING FUND,L.P. 26,400,625Domestically listed foreign
shares
Agricultural Bank of China—Penghua
Motivity Growth Mixed Fund
25,276,532RMB ordinary shares
BOCI SECURITIES LIMITED 20,334,459Domestically listed foreign
shares
China Everbright Bank—First-Trust
Leading Strategy Open-ended Fund
15,692,693RMB ordinary shares Bank of China—Invesco Great Wall Dingyi
Stock Open-ended Fund
13,810,081RMB ordinary shares
NOMURA SECURITIES CO.LTD 13,500,000Domestically listed foreign
shares
Industrial and Commercial Bank of
China—Hua An Mid-cap and Small-cap
Growth Stock Fund
12,113,097RMB ordinary shares
§3. Significant Events
3.1 Major changes in main accounting statement items and financial
indicators, as well as reasons for such changes
√Applicable □Inapplicable
I. Sales income for the first quarter registered a year-on-year growth
63.40%, which was mainly due to the Company’s efforts in developing
distinct fine products and increasing product competitiveness.
In the report period, the Company continued and deepened the value operation strategy, strengthened attack consciousness, an open mind and consciousness of reform and innovation, and accelerated the reform of the marketing organization. Meanwhile, it persisted in product innovation, strengthened quality control and developed distinct fine products. As a result, a rapid development took place in main businesses such as the color TV business, the cell phone business and the white electricity business.
In terms of the color TV business, the Company seized opportunities brought by the high-speed development of LED TVs and the rapid popularization of Web TV, promoting the Wangrui LED TV brand. It took the lead to popularize LED and Web TV and tried to take up a larger share in the LCD market, which ensured the Company’s leading position in the domestic color TV market.
In terms of the cell phone business, the Company made itself a distinct cell phone maker in terms of speed, constantly improved the product structure, expanded channels at home and abroad, and strictly controlled risks so as to further solidify Konka’s position in the domestic cell phone market.
In terms of the white electricity business, the Company studied market trends, developed fine products with power conservation as the main line, fashionable appearance, distinct preservation technologies and a high performance cost ratio, and increased the product coverage rate so as to achieve stable development of the white electricity business.
II. Due to reasons below, the net profit achieved by the Company in the report period decreased as compared with the same period of 2009.
1. In the report period, in order to fight for a larger share in the
flat-panel TV market, most domestic and foreign color TV brands reduced their product prices, which led to an enormously fierce price competition in the flat-panel TV market. As a result, the gross profit rate of the
Company ’s flat-panel TVs decreased considerably from that at the same period of last year.
2. In order to promote the Company ’s brand influence in the flat-panel TV market and fight for a large market share, expenses on market expansion increased to some degree.
3. Progress of new product development slowed down, which had certain impact on the profitability of color TV products in the report period. Due to the aforesaid factors, the net profit attributable to owners of the parent company achieved by the Company in the first quarter of 2010 went down as 11.45%compared with the same period of last year.
III. Non-business income increased by 310.49% from that at the same period of last year, which was mainly due to incomes from fixed asset disposal and penalties.
IV. Selling expenses increased by 49.74% from that at the same period of last year, which was mainly because expenses on market expansion increased to some degree in order to fight for a larger share in the flat-panel TV market.
V. Cash flows from operating activities decreased by 92.24% from that at the same period of last year, which was mainly due to much fewer discounts of notes receivable this year.
3.2 Explanation and analysis on progress of significant events, as well as relevant influence and solutions □Applicable √Inapplicable
3.3 Fulfillment of commitments made by the Company, shareholders and actual controller
√Applicable □Inapplicable
Commitment
Covenanter
Contents of commitments
Execution
Commitments
concerning share
merger reform
OCT Group Corporation (1)To promise that all non-tradable shares of KONKA GROUP CO.,
LTD held by it will not be listed for trading or transferring within
24 months since the date when it acquires the right to list in A
share market. (2) At the expiration of the aforesaid commitment
period, the original non-tradable shares of KONKA GROUP CO., LTD
sold through listing at Stock Exchange shall take up less than 5%
of total shares of KONKA GROUP CO., LTD within 12 months, and less
than 10% within 24 months. Up to now, there
was no share
subject to moratorium listed for trading or
transferring.
Commitments concerning share trading moratorium
Naught Naught Naught
Commitments made in the purchase report or the
Naught Naught Naught
report on equity
changes
Commitments made
in major assets
reorganization
Naught Naught Naught
Commitments made
in stock issuance
Naught Naught Naught
Other commitments
(including
supplementary
commitments)
Naught Naught Naught
3.4 Warnings of possible losses or significant changes of the accumulative
net profit during the period from the year-begin to the end of the next
reporting period compared with the same period of last year according to
prediction, as well as explanations on the reasons
□Applicable √Inapplicable
3.5 Other significant events
3.5.1 Securities Investment
□Applicable √Inapplicable
3.5.2 Reception of research, communication and visits in the reporting
period
Date Place
Way of
communica
tion
Visitors Topics discussed and materials provided
5 Jan. 2010 Meeting room of
the Company
Field
research
Guosen Securities, Yinhua
Fund Management Co., Ltd
and Caitong Securities
Brokerage Co., Ltd
Core competitive power, completive status of LCD
TV products and the Company’s status in color TV
industry
8 Jan. 2010 Meeting room of
the Company
Field
research
Donghai Securities and
Sinosafe General Insurance
Co.Ltd
Development strategy of the Company’s color TV
business new products of LCD TV and completive
status of LCD TV products
13 Jan. 2010 Meeting room of
the Company
Field
research
Invesco Great Wall Fund
Management Co., Ltd,
Morgan Stanley Huaxin
Funds
Status quo and development trend of color TV
industry the Company’s status in color TV
industry and completive status of LCD TV products
20 Jan. 2010 Meeting room of
the Company
Field
research
Essence Securities
development trend of mobile phone of the Company,
market prospect of new products of color TV and
progress of relevant work
26 Jan. 2010 Meeting room of
the Company
Field
research
Xiangcai Securities Co.,
Ltd
Investment in LCD module projects, basic situation
of color TV, mobile phone and white electricity
27 Jan. 2010 Meeting room of Field Central China Securities Particulars about putting into production of LCD
the Company research
module, development trend of color TV industry
19 Mar. 2010
Meeting room of the Company
Field research
Guotai Junan Securities
Co., Ltd, Bosera Fund, Lion Fund Management Co., Ltd, Penghua Funds and Changrun Asset Management
Core competitive power of the Company and sales of products for “Pushing home appliances to countryside ”
22 Mar. 2010
Meeting room of the Company
Field research
Bank of China Investment Management
Particulars about putting into production of LCD
module, competitive strategy of color TV
25 Mar. 2010
Meeting room of the Company
Field research
Bank of Communications Schroder Fund Management Co., Ltd
Particulars about color TV and mobile phone business of the Company, market competitive power
of color TV of the Company
30 Mar. 2010
Meeting room of the Company
Field research
China Asset Management Co., Ltd
Development trend of color TV industry, market
competitive power of color TV of the Company,
market prospect of new products of color TV and progress of relevant work
3.5.3 Other significant events □Applicable √Inapplicable
3.5.3 Other significant events √Applicable □Inapplicable
Analysis on risks and control
measures of derivative products held
in the report period (including but
not limited to market risk, liquidity
risk, credit risk, operation risk,
law risk, etc.)
When the Company operated every NDF portfolio, yield to maturity is fixed and there is no risk.
Main risks of NDF portfolio are as follows:
1. Risk from closing of bank pledged deposit, in case the bank close downs,
the pledged deposit is probably hard to call back in full.
2. Risk from foreign bank operated NDF portfolio being closed. In case the
foreign bank closes down, it is not possible to receive income from NDF
portfolio.
The Company always chooses large-sized bank similar as Bank of China to
cooperate to start NDF portfolio. Theses banks chosen by the Company operated
stably and healthily with good assets and credit, the probability of closing was small. It is basically out of consideration of loss from closing brought to the Company
Changes of market prices or fair values in the report period of the
invested derivatives. And the analysis on the fair value of the derivatives should include the specific use methods and the relevant assumptions and parameters.
Yield to maturity of NDF portfolio business operated by the Company is fixed and there is no change in fair value. Whether significant changes occurred to the Company ’s accounting policy Up to the public notice date, there is no special accounting method for NDF portfolio business and accounting principle was in accordance with Accounting
and specific accounting principles of derivatives in the report period compared to the previous report period
Standards for Business Enterprises. Specific opinion from independent directors, sponsors or financial
consultants on the Company ’s derivatives investment and risk control
Independent directors of the Company considered that NDF portfolio business is good for benefit from fluctuation of rate of RMB and get fixed income without risks, so it is necessary at some certain. The Company is gradually perfecting internal control for investment on derivative products, and it is feasible to adopted directed measures for risk control.
3.6.1 Holding of derivative products at the period-end √Applicable □Inapplicable
Unit: RMB Yuan
Type
Beginning contract amount
Closing contract
amount
Gains and losses in the report
period Proportion of closing contract amount in net assets at the
period-end
NDF portfolio 2,584,356,800.00 3,011,823,650.00
746,924.6276.92%Total 2,584,356,800.00 3,011,823,650.00
746,924.62
76.92%
§4. Appendix
4.1 Balance sheet
Prepared by Konka Group Co., Ltd 31 Mar. 2010 Unit: RMB Yuan
Balance at period-end
Balance at year-begin
Items
Consolidation
Parent company
Consolidation
Parent company
Current assets:
Monetary funds
3,838,408,501.63
3,127,207,462.43
3,624,480,380.25 2,920,787,369.99
Settlement fund reserve Dismantle fund
Transaction financial asset 4,658,494.003,766,384.003,673,164.00 2,781,054.00Notes receivable 2,787,764,593.032,555,446,445.152,807,539,700.27 2,679,933,632.86Account receivable 1,180,276,713.821,067,220,743.611,302,066,597.13 1,105,121,784.81Account paid in advance 164,399,256.07
337,239,333.81
275,850,813.27 259,306,577.60
Premium receivables Receivables from reinsurers
Reinsurance contract reserve receivables
Interest receivable 29,249,452.49
26,713,017.10
32,529,920.96 29,442,469.13
Dividend receivable
Other account receivable
66,891,681.95
999,832,977.41
19,572,445.66 863,563,519.29
Financial assets purchased under agreements to
resell
Inventories
4,109,056,447.72
3,429,165,467.26
3,580,780,457.01 2,880,442,228.65
Non-current assets due within 1 year
Other current assets
Total current assets 12,180,705,140.7111,546,591,830.7711,646,493,478.55 10,741,378,636.33 Non-current assets:
Loans and advance
Available for sale financial assets 10,018,505.0010,018,505.0010,268,121.10 10,268,121.10 Held to maturity investments
Long-term account receivable
Long-term equity investment 57,800,445.231,288,602,169.8757,800,445.23 1,278,602,169.87 Investing property
Fixed asset 1,409,437,275.01378,437,034.791,433,674,626.29 397,886,724.19 Project in construction 83,446,872.0449,619,658.1061,087,946.18 35,542,625.38 Engineering material
Fixed asset disposal 21,042,047.4120,851,110.89
Bearer biological asset
Oil assets
Intangible assets 166,427,145.6118,441,453.87167,502,525.56 18,952,170.77 Development expense
Goodwill 3,943,671.533,943,671.53
Long-term expense to be apportioned 14,279,429.365,549,052.2115,774,783.95 6,011,778.39 Deferred tax assets 149,220,962.22137,945,439.24150,686,419.10 139,410,896.12 Other non-current assets
Total of non-current assets 1,915,616,353.411,888,613,313.081,921,589,649.83 1,886,674,485.82 Total assets 14,096,321,494.1213,435,205,143.8513,568,083,128.38 12,628,053,122.15 Current liabilities:
Short-term loans 3,056,658,224.672,776,008,050.002,770,014,060.00 2,553,412,550.00 Loans from central bank
Deposits received and hold for others
Placements From Banks Other Financial
Institutions
Transaction financial liabilities
Notes payable 2,506,742,833.772,159,660,615.292,884,697,072.42 2,546,131,169.12 Account payable 2,100,806,864.122,246,395,884.842,599,242,285.04 2,490,629,061.71 Account received in advance 279,382,654.4595,148,340.36279,331,464.38 162,177,552.53 Financial assets sold under agreements to
repurchase
Handling charges and commission payable
Employee’s compensation payable 155,020,093.8073,578,603.13193,217,075.52 94,499,554.84 Tax payable -221,591,278.82-160,532,915.20-132,897,711.14 -74,701,335.32 Interest payable 21,768,518.8219,810,821.9623,633,016.78 21,675,319.92 Dividend payable 804,527.20804,527.20
Other account payable 1,955,812,041.772,342,598,278.21763,923,600.66 940,384,863.17 Due to reinsurers
Insurance contract reserve
Customer deposits
Amount payables under security underwriting
Non-current liabilities due within 1 year
Other current liabilities
Total current liabilities 9,855,404,479.789,552,667,678.599,381,965,390.86 8,734,208,735.97
Non-current liabilities:
Long-term borrowings
Bonds payable
Long-term payables
Specific purpose account payables
Estimated liabilities
Deferred tax liabilities 1,308,715.59611,831.881,308,715.59 611,831.88
Other non-current liabilities 89,141,048.4862,205,048.4878,541,048.48 62,205,048.48
Total non-current liabilities 90,449,764.0762,816,880.3679,849,764.07 62,816,880.36
Total liabilities 9,945,854,243.859,615,484,558.959,461,815,154.93 8,797,025,616.33
Owner’s equity (or shareholders’ equity):
Paid-in capital (or share capital) 1,203,972,704.001,203,972,704.001,203,972,704.00 1,203,972,704.00
Capital surplus 1,257,329,860.221,249,199,693.641,257,449,727.58 1,249,319,561.00
Less: Treasury stock
Specific reserve
Reserved fund 809,307,995.80804,258,523.06809,307,995.80 809,307,995.80
General risk provision
Retained earnings 649,404,128.11562,289,664.20613,778,898.84 568,427,245.02
Foreign exchange difference -4,638,508.94-9,141,464.66
Total owners’ equity attributable to holding
3,915,376,179.193,819,720,584.903,875,367,861.56 3,831,027,505.82 company
Minority interest 235,091,071.08230,900,111.89
Total owner’s equity 4,150,467,250.273,819,720,584.904,106,267,973.45 3,831,027,505.82
Total liabilities and owner’s equity 14,096,321,494.1213,435,205,143.8513,568,083,128.38 12,628,053,122.15
4.2 Income statement
Prepared by Konka Group Co., Ltd Jan.-Mar. 2010 Unit: RMB Yuan
Amount in this period Amount in the previous period Items
Consolidation Parent company Consolidation Parent company
I. Total sales 4,266,791,664.594,057,208,187.952,611,315,292.67 2,215,990,440.32
Including: Sales 4,266,791,664.594,057,208,187.952,611,315,292.67 2,215,990,440.32
Interests income
Premium income
Handling charges and commission income
II. Total cost of sales 4,230,971,313.374,079,360,937.602,573,658,346.25 2,193,140,792.45
Including: Cost of sales 3,631,933,127.273,605,806,531.862,156,286,288.52 1,855,513,841.46
Interests expenses
Service charge and commission income
Cash surrender value
Claim expenses-net
Provision for insurance contract reserves-net
Insurance policy dividend paid
Reinsurance expense
Business taxes and surcharges 930,892.10224,064.47335,691.09 32,243.60
Distribution expenses 460,555,582.14387,981,203.70307,567,109.71 267,162,582.20
Administrative expenses 121,238,958.2372,609,369.19100,666,366.22 65,200,389.93
Financial costs 22,162,244.2119,554,612.1112,951,059.59 9,783,944.26
Impairment loss -5,849,490.58-6,814,843.73-4,148,168.88 -4,552,209.00
Add: gain/(loss) from change in fair value
985,330.00985,330.00
(“-” means loss)
Gain/(loss) from investment (“-” means loss) 10,529.3510,529.35
Including: income form investment on affiliated
enterprise and jointly enterprise
Foreign exchange difference (“-” means loss)
III. Business profit (“-” means loss) 36,816,210.57-21,156,890.3037,656,946.42 22,849,647.87
Add: non-business income 15,621,101.4713,303,772.473,805,441.94 1,776,910.89
Less: non-business expense 2,321,471.62339,448.58817,792.05 475,236.05
Including: loss from non-current asset disposal 1,704,521.45112,753.59366,211.13 204,163.93
IV. Total profit (“-” means loss) 50,115,840.42-8,192,566.4140,644,596.31 24,151,322.71
Less: Tax expense 10,299,651.962,994,487.154,062,155.42 1,040,906.12
V. Net profit (“-” means loss) 39,816,188.46-11,187,053.5636,582,440.89 23,110,416.59
-Attributable to parent company 35,625,229.27-11,187,053.5640,231,160.32 23,110,416.59
-Minority interest 4,190,959.19-3,648,719.43
VI. Earnings per share
(I) Basic earnings per share 0.0296-0.00930.0334 0.1934
(II) Diluted earnings per share 0.0296-0.00930.0334 0.1934
Ⅶ. Other comprehensive income 4,383,088.36 -119,867.36 325,965.11 0.00
Ⅷ. Total comprehensive income 44,199,276.82 -11,306,920.92 36,908,406.00 23,110,416.59
Attributable to owners of parent company 40,008,317.63 -11,306,920.92 40,557,125.43 23,110,416.59
Attributable to minority shareholders 4,190,959.19 0.00 -3,648,719.43 0.00
4.3 Cash flow statement
Prepared by Konka Group Co., Ltd Jan.-Mar. 2010 Unit: RMB Yuan
Amount in this period Amount in the previous period Items
Consolidation Parent company Consolidation Parent company
I. Cash flows from operating activities
Cash received from sales of goods or rending
4,720,978,879.593,968,062,175.853,776,653,886.48 3,235,207,703.10 of services
Net increase of deposits received and held for
others
Net increase of loans from central bank
Net increase of inter-bank loans from other
financial assets
Cash received against original insurance
contract
Net Cash received from reinsurance
Net increase of client deposit and investment
Net increase of disposal of tradable financial
assets
Cash received as Interests, fees and
commissions received
Net increase of inter-bank fund received
Cash received under repurchasing, net
Tax returned 65,799,521.849,037,696.2618,717,923.13 8,178,612.00
Other cash received from operating activities 98,402,884.47241,162,937.1793,669,493.85 24,642,501.83
Sub-total of cash inflow from operating
4,885,181,285.904,218,262,809.283,889,041,303.46 3,268,028,816.93 activities
Cash paid for goods and services 3,753,815,185.013,410,254,933.722,317,602,968.35 2,183,739,659.17
Net increase of loans and advances
Net increase of deposit in central bank, banks
and other financial institutions
Cash paid for original contract claim
Cash paid for interests, fees and commission
Cash paid for policy dividend
Cash paid to and for employees 303,976,986.43171,755,451.45250,408,626.70 152,092,114.26
Cash paid for all types of taxes 439,190,665.59352,953,464.00294,783,090.76 248,019,254.34
Other cash paid relating to operating
325,889,782.15290,804,472.03223,337,118.99 162,218,767.69 activities
Sub-total of cash outflows 4,822,872,619.184,225,768,321.203,086,131,804.80 2,746,069,795.46
Net cash outflow in operating activities 62,308,666.72-7,505,511.92802,909,498.66 521,959,021.47
II. Cash Flows from Investing Activities
Cash received from return of investments 95,940.0095,940.00
Cash received from investment income 10,529.3510,529.35
Net cash received from disposal of fixed
assets, intangible assets and other long-term
22,271,191.5420,731,311.541,908,031.60 1,115,630.21 assets
Net cash received from disposal of
subsidiaries and other operating units
Other cash received relating to investing
13,640,000.00
activities
Sub-total of cash inflows of investing
36,017,660.8920,837,780.891,908,031.60 1,115,630.21 activities
Cash paid for acquisition of fixed assets,
53,138,753.6216,682,803.3861,725,365.97 624,304.48 intangible assets and other long-term assets
Cash paid for acquisition of investments 10,000,000.00
Net increase of pledge loans
Net cash paid for acquisition of subsidiaries
and other operating units
Other cash paid relating to investing
activities
Sub-total of cash outflows of investing
53,138,753.6226,682,803.3861,725,365.97 624,304.48 activities
Net cash inflow from investing activities -17,121,092.73-5,845,022.49-59,817,334.37 491,325.73
III. Cash Flows from Financing Activities:
Cash received from investment
Including: Cash received from minority
shareholders of subsidiaries
Cash received from borrowings 453,343,192.74376,230,000.003,000,000.00
Cash received from bonds issuing
Cash received relating to financing
50,710,818.4750,680,356.17938,373,800.28 901,296,005.42 activities
Sub-total of cash inflows of financing
504,054,011.21426,910,356.17941,373,800.28 901,296,005.42 activities
Cash paid for repayments of borrowings 76,033,174.1034,206,000.00211,509,922.39 199,775,772.34
Cash paid for dividends, profit distribution
1,173,792.711,139,872.983,597,978.03 8,340.00 or interest
Including: dividends or profits paid to
minority shareholders by subsidiaries
Other cash paid relating to financing
396,763,432.50376,230,000.00709,534,561.56 709,533,838.65 activities
Sub-total of cash outflows of financing
473,970,399.31411,575,872.98924,642,461.98 909,317,950.99 activities
Net cash inflow from financing activities 30,083,611.9015,334,483.1916,731,338.30 -8,021,945.57
IV. Effect of foreign exchange rate changes -2,546,700.56-2,665,106.35-171,373.86
V. Net decrease in cash and cash equivalents 72,724,485.33-681,157.57759,652,128.73 514,428,401.63
Add : Opening amount of cash and cash
749,501,416.29341,440,119.99845,026,867.06 358,631,499.14 equivalents
VI. Closing balance of cash and cash equivalents 822,225,901.62340,758,962.421,604,678,995.79 873,059,900.77
4.4 Auditor’s report
Audit opinion: Un-audited
Board of Directors of
Konka Group Co., Ltd
Apr. 30, 2010
我国私募基金投资的信用风险测度 与管理问题研究 培养单位:金融学院 学科专业:金融学 作者姓名: 指导教师:
Research on Credit Risk Measurement and Management of Private Fund Investment in China Culture unit:School of Economics and Finance Major: Finance Candidate:Zhang Jingjing Supervisor:vice-Prof. Cheng Fengxian
第5章我国私募基金投资的信用风险状况实证考察 5.1 KMV 模型的概述 KMV 模型是KMV 公司在1997年基于改进的期权定价公式建立的估计借款企业违约概率的模型,又叫预期违约率模型。此后KMV 公司收集了美国3400家上市公司自1973年以来的数据资料,并利用这些企业违约数据和未违约数据建立了庞大的企业信用资料数据库,通过分析,建立统计对应关系,并应用于实际中,取得了良好的预测效果。它的创新在于,从借款企业,即股权持有者的角度考虑,结合借款企业股价变化和波动情况以及公司财务水平来考虑偿还问题。模型将企业分为违约和不违约两种状态,而信用风险损失发生在企业违约时。 5.1.1 KMV 模型的基本原理 1997年10月10日,第二十九届诺贝尔经济学奖授予了两位美国学者,哈佛商学院教授罗伯特.默顿(Robert Merton)和斯坦福大学教授迈伦.斯克尔斯(Myron Scholes)。他们创立和发展的布莱克—斯克尔斯期权定价模型为包括股票、债券、货币、商品在内的新兴衍生金融市场的各种以市价价格变动定价的衍生金融工具的合理定价奠定了基础。 KMV 模型的理论基础即为Black-Scholes 期权定价理论以及Merton 模型。它将公司股票的市场价值看作以公司资产为标的,以公司一定期间内到期的债务的账面价值为行权价格的看涨期权。通过Black-Scholes 期权定价公式求解公司资产的波动率,从而预测公司的违约概率。 (一) Black-Scholes 期权定价理论 1973年Fisher Black, Myron Scholes 首先提出了期权定价理论,并由Robert Merton 进行了进一步的整理,该模型根据无套利的原理,并通过一系列的变换,他们得到了Black-Scholes-Merton 微分方程: 2222 12p p p rs s rp t s s σ???++=??? (1) 其中S 为标的资产的价格,P 为以S 为标的的看涨期权的价格,t 为一时间点,r 为短期无风险利率。上式的解与该式的边界条件有关,对于欧式看涨期权,该边界条件为:P=max(S-K,0),(t=T) 上述微分方程最著名的解便是看涨期权与看跌期权的定价公式:
资产负债表质量分析 一、搞懂资产负债表的基本武功原理 资产负债表的基本架构即是有名的“会计等式”: 资产=负债+所有者权益 (一)会计等式右边 代表资金的来源。资金的来源可能是负债或是所有者权益。 负债与所有者权益的相对比率一般称为“财务结构”。负债越多会怎样?(二)会计等式左边 代表资金的用途。资金可以用各种形式的资产拥有,例如货币资金、存货、应收及预付款项、固定资产等。(三)按流动性分类。 流动性的判断: 1.预计在一个正常营业周期中变现、出售或耗用(清偿) 2.主要为交易目的而持有 3.预计在资产负债表日起一年内(含一年)变现(清偿)
4.自资产负债表日起一年内,交换其 他资产或清偿负债的能力不受限制的现金或现金等价物(企业无权将清偿推迟到B/S日后一年以上) (四)流动负债 二、面对真实的资产及负债状况 1、关于布什的笑话 In your left brain,there is nothing left.In your right brain,there is nothing right. 2、管理层的误导:不愿承认部分资产 已没有价值,刻意将部分负债项目转变成“隐藏性负债” 3、资产比负债更危险 对一般人而言:资产比负债好 对企业而言:资产比负债危险(为什么?) 三、审视企业的资产质量 1、货币资金也不让人放心 正常的理解是:货币资金虽然收益性不好,但是有很多的货币资金让人心安。现实状况是:
案例一:闽福发年收入只有2~3个 亿元(实际上真正的收入估计连1个亿 元都没有达到),但近几年货币资金一 直保持较高余额,甚至超过了年收入额,而且闽福发的货币资金很有意思,除了2002年有“其它货币资金3550万元”外,其余基本都是银行存款,而这些银行存款都是没有受限的。而实际上,闽福发大股东的股权早就被司法冻结或质押,闽福发截至2005年半年报,资产 总额11.08亿元,股东权益.4.60亿元,资产负债表58.48%,而这只是账面数,如果扣除大量的泡沫、虚假资产,怀疑闽福发早已资不抵债,在此背景下,竟然还有2个亿甚至3个亿元无受限的银行存款,只能断定这些银行存款实为虚构或早已受限。这是闽福发货币资金余额表(如下):
深康佳A2020年上半年财务分析综合报告 一、实现利润分析 2020年上半年利润总额为14,566.99万元,与2019年上半年的48,902.22万元相比有较大幅度下降,下降70.21%。利润总额主要来自于对外投资所取得的收益。在营业收入大幅度下降的同时经营利润也大幅度下降,企业经营业务开展得很不理想。 二、成本费用分析 2020年上半年营业成本为1,626,899.34万元,与2019年上半年的2,467,404.24万元相比有较大幅度下降,下降34.06%。2020年上半年销售费用为96,922.44万元,与2019年上半年的106,794.59万元相比有较大幅度下降,下降9.24%。从销售费用占销售收入比例变化情况来看,2020年上半年销售费用大幅度下降的同时营业收入也有较大幅度的下降,但收入下降快于投入下降,经营业务开展得不太理想。2020年上半年管理费用为44,091.58万元,与2019年上半年的34,792.46万元相比有较大增长,增长26.73%。2020年上半年管理费用占营业收入的比例为2.52%,与2019年上半年的1.34%相比有所提高,提高1.18个百分点。这在营业收入大幅度下降情况下常常出现,但要采取措施遏止盈利水平的大幅度下降趋势。2020年上半年财务费用为38,704.09万元,与2019年上半年的41,426.05万元相比有较大幅度下降,下降6.57%。 三、资产结构分析 2020年上半年企业资产不合理占用的数额较大,资产的盈利能力较低,资产结构不太合理。2020年上半年应收账款出现过快增长。其他应收款增长过快。从流动资产与收入变化情况来看,流动资产增长的同时收入却在下降,资产的盈利能力明显下降,与2019年上半年相比,资产结构偏差。 四、偿债能力分析 内部资料,妥善保管第1 页共4 页
中国股票代码大全 000001 深发展A 000562 宏源证券000563 陕国投A 000686 东北证券000728 国元证券 000783 长江证券002142 宁波银行 600000 浦发银行600015 华夏银行 600016 民生银行600030 中信证券 600036 招商银行600109 国金证券 600643 爱建股份600816 安信信托 600837 海通证券601009 南京银行 601099 太平洋601166 兴业银 601169 北京银行601318 中国平安 601328 交通银行601398 工商银行 601601 中国太保601628 中国人寿 601939 建设银行601988 中国银行 601998 中信银行
商业板块行情 002024 苏宁电器 600415 小商品城600827 友谊股份 600694 大商股份600616 第一食品 600655 豫园商城600628 新世界 600859 王府井600825 新华传媒 600861 北京城乡600361 华联综超 600682 南京新百600838 上海九百 000501 鄂武商A600723 西单商场 600830 香溢融通600778 友好集团 000889 渤海物流000056 深国商 000715 中兴商业600729 重庆百货 600824 益民商业000759 武汉中百 000987 广州友谊600327 大厦股份 600865 百大集团
600898 三联商社 通信板块 600050 中国联通 000063 中兴通讯 000100 TCL 集团600775 南京熊猫 600498 烽火通信 000016 深康佳A 600289 亿阳信通 000910 大亚科技 600654 飞乐股份600776 东方通信600640 中卫国脉600130 波导股份000988 华工科技600680 上海普天600345 长江通信000062 深圳华强000733 振华科技 000070 特发信息 600105 永鼎股份 600149 华夏建通 600677 航天通信 000890 法尔胜 002017 东信和平 000829 天音控股 600485 中创信测 600522 中天科技 000851 高鸿股份 000586 汇源通信 600487 亨通光电 000602 金马集团 600658 兆维科技 000615 湖北金环 房地产板块 600663 陆家嘴 000002 万科A
格力电器获利能力分析 获利能力是指企业赚取利润的能力,反映企业的资金增值能力。获利能力分析就是要从各个视角对企业赚取利润的能力进行宣分析和定性分析,其内容覆盖面非常广泛,主要凶手企业从营业收入中获取利润的能力、企业运用资产赚取利润的能力以及股东的投资回报水平三个方面。 一、格力电器获利能力指标 获利能力指标2011 20122013 销售毛利率(%) 营业利润率(%) 销售净利率(%) 总资产收益率(%) 总资产净利率(%) 净资产收益率(%) 基本每股收益(元/股)
二、格力电器获利能力指标同行业比较 1、2011年度获利能力比较 格力电器及同行业2011年度获利能力指标比较表 获利能力指标格力电器排名行业均值行业最高深康佳A 销售毛利率(%)11 营业利润率(%)7 销售净利率(%)7 总资产收益率(%)10 总资产净利率(%)8 净资产收益率(%) 1 基本每股收益(元/股) 1
2、2012年度获利能力比较 获利能力指标格力电器排名行业均值行业最高深康佳A 销售毛利率(%) 5 营业利润率(%) 5 销售净利率(%) 4 总资产收益率(%)7 总资产净利率(%) 6 净资产收益率(%) 2 基本每股收益(元/股) 1 三、2013年度获利能力比较 获利能力指标格力电器排名行业均值行业最高深康佳A 销售毛利率(%) 4 营业利润率(%) 3 销售净利率(%) 3 总资产收益率(%) 6 总资产净利率(%) 5 净资产收益率(%) 2 基本每股收益(元/股) 1
三、格力电器获利能力指标分析 1、销售毛利率分析 项目2011年度2012年度2013年度格力电器 排名1154行业均值 行业最高 深康佳A
(财务报表管理)四川长虹与深康佳A财务报表比较 分析
四川长虹与深康A 年度报表比较案例分析———2006-2009年度 姓名:蒋巧 学号:200804084151 班级:08级会计2班 报告日期:2010年12 月23 日 案例分析框架 一、行业背景 1、竞争激烈。我国电视市场经过几年的高速发展,逐渐形成了国产品牌几分天下的局面,属于垄断竞争阶段,由于技术含量不高,竞争十分激烈。 2、市场需求增长日趋减缓。对彩电的需求已从原来“有的满足”上升到“质的满足”,有技术创新能力的企业将取得优势。 3、行业利润率下降。随着市场和竞争两方面的因素,电视行业已从高额利润阶段到微利阶段,在微利阶段企业将面临严峻的挑战。 4、WTO的影响。随着我国加入WTO的进程加快,将对我国电视生产企业带来一定影响,总的来说是利大于弊,有利于国产品牌进入国际市场。 5、长虹公司和康佳公司是国内两个最大的电视制造企业,长虹的市场占有率曾经遥遥领先,但目前两家公司基本是并驾齐驱,康佳有后来居上之势。 二、公司概况
1、四川长虹 公司名称:四川长虹电器股份有限公司 简称:A股:四川长虹600839 行业类别:电子产品-->家用电器 上市地点:上海证券交易所 上市日期:A股:1994-03-11 法人代表:赵勇 公司注册地址:四川省绵阳市高新区绵兴东路35号 同行业公司数(家):126 注册资本(万元):284732 主营业务范围:视频产品、网络产品、激光读写系列产品、数字通讯产品、电池系列产品、通讯传输设备、电子部品。 2、深康A 公司名称:康佳集团股份有限公司 简称:A股:康佳集团000016 行业类别:电子产品-->家用电器 上市地点:深圳证券交易所 上市日期:A股:1992-03-27 法人代表:侯松容 公司注册地址:深圳市南山区华侨城 同行业公司数(家):400 注册资本(万元):120397
深康佳A2018年财务分析详细报告 一、资产结构分析 1.资产构成基本情况 深康佳A2018年资产总额为3,298,506.19万元,其中流动资产为 2,184,329.76万元,主要分布在存货、应收账款、货币资金等环节,分别占企业流动资产合计的25.12%、20.41%和19.91%。非流动资产为 1,114,176.43万元,主要分布在长期投资和固定资产,分别占企业非流动资产的34.76%、21.63%。 资产构成表 2.流动资产构成特点
企业持有的货币性资产数额较大,约占流动资产的35.17%,表明企业的支付能力和应变能力较强。不过,企业的货币性资产主要来自于短期借款及应付票据,应当对偿债风险给予关注。 流动资产构成表 3.资产的增减变化 2018年总资产为3,298,506.19万元,与2017年的2,355,873.55万元相比有较大增长,增长40.01%。
4.资产的增减变化原因 以下项目的变动使资产总额增加:在建工程增加204,100.77万元,长期投资增加162,444.97万元,货币资金增加113,609.93万元,其他流动资产增加102,888.93万元,应收账款增加101,495.76万元,商誉增加 85,209.38万元,固定资产增加82,305.61万元,存货增加79,724.17万元,预付款项增加56,985.61万元,无形资产增加53,271.89万元,递延所得税资产增加33,149.17万元,其他非流动资产增加30,818.69万元,其他应收款增加22,379.16万元,一年内到期的非流动资产增加2,231.82万元,交易性金融资产增加546.5万元,应收利息增加224.64万元,应收股利增加54.78
证券投资心得体会与感想总结 证券投资的一学期学习已经接近尾声,或许收获的东西,比起有些同学还是算很少的吧。不过我觉得只要努力了,去尝试的做了所有的步骤,有所得,就算足够。 理论课上,我们具体的学习了证券投资的基础知识,了解了证券市场的一些内容,并且学习了证券投资的宏观经济分析,以及技术分析的主要理论和方法。在随后的实验课上,老师让我们在模拟炒股的软件上自己操作体会,慢慢的也做到了将理论和实践的统一。 在模拟软件上,我注册了一个帐号,可用资金是500000元,因为对行情并不怎么熟悉,只是对老师讲的比较好的股票和看起来走势较好的股票进行了一定量的委托购买,虽然仅仅是一个虚拟的环境,虚拟的资金,但是毕竟还是希望做好的想法,于是在之后的时间里,竟然也开始提高了对股票走势的关注度。 最开始学习证券投资学的时候,对于理论知识不太看重,感觉它讲的很枯燥,可能也并不实用,可是经历了网络模拟交易后,我觉得任何事情都不是单独的,学习了理论知识可以用它来指导实践,股市肯定不会是单靠运气来盲目支持的,需要掌握一定的技术分析能力和理论知识。因为对理论知识的生疏,在刚开始进行模拟交易时,技术分析一点都不懂,每次都是一边看着书上的知识,一边对着电脑进行技术上的分析。尽管这样但还是不懂的如何去运用,也不懂其中的一些投资技巧。在逐步的学习中,我慢慢懂得通过阳线及阴线的形态去选择股票,再结合当天的成交量,来判断是否有升的可能。不知不觉间,竟然有了一定的改进和提高。 在购买的记录中,我买入了万科A的股票。最开始买的时候因为大致上看了一下,好像是有点盈利的,在7号左右那几天,它的涨跌都不是很大,振幅也就在5%左右,技术评分也比较强。另外看了一下新闻之类的,了解到2009年4月份万科公司实现销售面积59.5万平方米,销售金额52.7亿元,分别比2008年同期增长23.7%和22.0%。2009年1-4月份公司累计销售面积212.0万平方米,销售金额174.9亿元,分别比2008年同期增长30.4%和21.4%。说明它的发展业绩一直都还是处于增长趋势。另外,它是深市的第一权重股,是控盘股之一,也是房地产板块的龙头股票,所以它是有持有价值的。
深康佳A2019年三季度财务状况报告 一、资产构成 1、资产构成基本情况 深康佳A2019年三季度资产总额为4,166,849.75万元,其中流动资产为2,728,927.84万元,主要分布在货币资金、存货、应收账款等环节,分别占企业流动资产合计的25.63%、23.71%和19.73%。非流动资产为1,437,921.91万元,主要分布在长期投资和在建工程,分别占企业非流动资产的24.92%、21.81%。 资产构成表 项目名称 2019年三季度2018年三季度2017年三季度 数值百分比(%) 数值百分比(%) 数值百分比(%) 总资产4,166,849.7 5 100.00 3,145,942.2 3 100.00 2,300,113.6 6 100.00 流动资产2,728,927.8 4 65.49 2,202,337.6 1 70.01 1,827,395.2 79.45 长期投资358,327.4 8.60 420,944.86 13.38 182,404.86 7.93 固定资产255,656.73 6.14 230,502.47 7.33 163,439.35 7.11 其他823,937.78 19.77 292,157.28 9.29 126,874.26 5.52 2、流动资产构成特点 企业持有的货币性资产数额较大,约占流动资产的32.54%,表明企业的支付能力和应变能力较强。不过,企业的货币性资产主要来自于短期借款及应付票据,应当对偿债风险给予关注。企业流动资产中被别人占用的、应当收回的资产数额较大,约占企业流动资产的24.02%,应当加强应收款项管理,关注应收款项的质量。
深康佳a20XX财务报表分析总结建议 篇一:深康佳财务报告分析 1.公司基本情况 1.1公司简介 康佳集团成立于1980年5月21日,前身是“广东光明华侨电子工业公司”,是中国改革开放后诞生的第一家中外合资电子企业,初始投资4300万港元。1991年,康佳集团改组为中外公众股份制公司。1992年,康佳a、B股股票同时在深圳证券交易所上市,现有总资产近百亿元、净资产近四十亿元、总股本12.04亿股,华侨城集团为第一大股东。 康佳集团拥有覆盖面广、服务完善的制造营销服务网络,康佳先后在华南、东北、西北、华东和西南组建了东莞康佳、牡丹江康佳、陕西康佳、安徽康佳和重庆康佳等五大彩电生产基地。在国内建立了50多个营销分公司、数百个销售经营部及3000多个维修服务网点,海外业务也已拓展到世界100多个国家和地区。康佳彩电国内零售市场占有率连续六年位居第一,手机也进入国产品牌三甲行列,“KonKa 康佳”商标被国家认定为“中国驰名商标”,并入选“中国最有价值品牌”,品牌价值达150多亿元。 1.2经营范围: 康佳集团主营业务为研究开发、生产经营彩色电视机、手机、白色家
电、生活电器。同时也研究开发、生产经营家庭视听设备,iPTV机顶盒,数字电视接收器(含卫星电视广播地面接收设备),数码产品,移动通信设备及终端产品,日用电子产品,汽车电子产品,卫星导航系统,智能交通系统,防火防盗报警系统,办公设备,电子计算机,显示器,大屏幕显示设备的制造和应用服务,LEd(oLEd)背光源、照明、发光器件制造及封装,生产经营电子元件、器件,模具,塑胶制品,各类包装材料,并从事相关产品的技术咨询和服务。从事以上所述产品(含零配件)的批发、零售、进出口及相关配套业务,销售自行开发的技术成果,提供电子产品的维修、培训、咨询等售后配套服务,普通货物运输,国 内货运代理,仓储服务,企业管理咨询服务,自有物业租赁和物业管理业务,废旧电器电子产品回收(不含拆解)(由分支机构经营),以承接服务外包方式从事系统应用管理和维护、信息技术支持管理、银行后台服务、财务结算、人力资源服务、软件开发、呼叫中心、数据处理等信息技术和业务流程外包服务。 1.3主要股东: 1.4企业文化 企业的长远使命是打造世界级中国企业吗。企业愿景是打造一个值得信赖的数字娱乐品牌;一个一流的家庭、手持、车载领域的数字娱乐产品和服务提供商;一群怀抱远大理想、拥有强烈荣誉感、共享经营成就的康佳人。企业核心理念为创造卓越成就梦想。企业精神是超越自我进取高远。企业经营理念是价值经营。发展理念是唯发展才能生
深康佳A2020年一季度经营风险报告 内部资料,妥善保管 第 1 页 共 4 页 深康佳A2020年一季度经营风险报告 一、经营风险分析 1、经营风险 深康佳A2020年一季度盈亏平衡点的营业收入为1,265,704.98万元,表示当企业该期营业收入超过这一数值时企业会有盈利,低于这一数值时企业会亏损。企业当期经营业务收入未达到盈亏平衡点,经营业务不安全,经营风险较大。 2、财务风险 企业净利润为负,负债经营是否可行,取决于能否扭亏为盈。 经营风险指标表 项目名称 2020年一季度 2019年一季度 2018年一季度 数值 增长率(%) 数值 增长率(%) 数值 增长率(%) 盈亏平衡点 1,265,704.9 8 -27.78 1,752,583.4 9 87.73 933,588.18 0 营业安全率 -0.62 0.9 -0.63 -211.88 -0.2 0 经营风险系数 -6.09 -343.44 2.5 -46.39 4.66 0 财务风险系数 9.5 751.57 1.12 -12.08 1.27 二、经营协调性分析 1、投融资活动的协调情况 从长期投资和融资情况来看,企业长期投融资活动能为企业提供413,941.63万元的营运资本,投融资活动是协调的。 营运资本增减变化表 项目名称 2020年一季度 2019年一季度 2018年一季度 数值 增长率(%) 数值 增长率(%) 数值 增长率(%) 营运资本 413,941.63 264.75 113,486.68 -71.32 395,720.17 0 所有者权益 974,553.86 1.17 963,301.59 15.82 831,738.44 0 非流动负债 1,178,899.0 4 216.45 372,541.67 995.2 34,015.86 0 固定资产 210,335.87 -5.74 223,156.08 40.6 158,717.03
证券代码:000016、200016 证券简称:深康佳A、深康佳 B 公告编号:2020-27债券代码:114418、114423 债券简称:19康佳01、19康佳02 114488、114489 19康佳03、19康佳04 114523、114524 19康佳05、19康佳06 康佳集团股份有限公司 关于聘请2020年度财务报表审计机构和 内部控制审计机构的公告 本公司及董事局全体成员保证信息披露的内容真实、准确、完整,没有虚假记载、误导性陈述或重大遗漏。 一、拟聘任会计师事务所事项的情况说明 为保持康佳集团股份有限公司(下称“本公司”)审计工作的连续性和稳定性,本公司拟续聘信永中和会计师事务所(特殊普通合伙)(下称“信永中和会计师事务所”)为本公司2020年度财务报表审计机构和内部控制审计机构。本公司管理层将与信永中和会计师事务所协商确定2020年度审计费用,聘期1年。 信永中和会计师事务所具有多年从事证券服务业务的经验,具备为上市公司提供审计服务的经验与执业能力,能为公司提供公正、公允的审计服务。在承担本公司2019年度财务报表及内部控制审计工作中,信永中和会计师事务恪守独立审计原则,工作勤勉尽责,公允合理地发表审计意见,独立、客观、公正地完成了本公司2019年度审计工作。信永中和会计师事务所能够谨守独立,切实做到专业胜任、持续维护了其较好的诚信记录且具备投资者保护能力。 本公司董事局于2020年4月20日(星期一)召开了第九届董事局第二十五次会议,会议审议通过了《关于聘请2020年度财务报表审计机构和内部控制审计机构的议案》。公司共有7名董事,实到董事7名,董事局以7票同意,0票反对,0票弃权审议通过该项议案。 根据有关法律法规及本公司章程的有关规定,本议案还须提交股东大会审议。 二、拟聘任会计师事务所的基本信息 (一)机构信息 信永中和会计师事务所最早可追溯到1986年成立的中信会计师事务所,至今已有30多年的历史。2000年,信永中和会计师事务所有限责任公司正式成立,2012年,信永中和会计师事务所由有限责任公司成功转制为特殊普通合伙制事务所,注册地址:北京市东城区朝阳门北大街8号富华大厦A座8层,注册资本:3,600万元。
康佳集团股份有限公司 章程 (2020年5月18日经康佳集团2019年年度股东大会审议通过) (二○二〇年修订) 二○二〇年五月十八日
康佳集团股份有限公司章程 (2020年修订) 目录 第一章总则 第二章经营宗旨和范围 第三章股份 第一节股份发行 第二节股份增减和回购 第三节股份转让 第四章股东和股东大会 第一节股东 第二节股东大会的一般规定 第三节股东大会的召集 第四节股东大会的提案与通知 第五节股东大会的召开 第六节股东大会的表决和决议 第五章董事局 第一节董事 第二节董事局 第六章公司党委 第七章总裁及其他高级管理人员 第八章监事会 第一节监事 第二节监事会
第九章财务会计制度、利润分配和审计 第一节财务会计制度 第二节内部审计 第三节会计师事务所的聘任 第十章通知与公告 第一节通知 第二节公告 第十一章合并、分立、增资、减资、解散和清算第一节合并、分立、增资和减资 第二节解散和清算 第十二章修改章程 第十三章附则
第一章总则 第一条为维护公司、股东和债权人的合法权益,规范公司的组织和行为,根据《中华人民共和国公司法》(以下简称《公司法》)、《中华人民共和国证券法》(以下简称《证券法》)和其他有关规定,制订本章程。 第二条公司系依照《公司法》和经国务院授权国家体改委、财政部、中国人民银行、国家国有资产管理局批准并于一九九二年二月十九日由深圳市人民政府颁发的《深圳市股份有限公司暂行规定》以及其他有关规定成立的股份有限公司(以下简称“公司”)。 公司以募集方式设立;在深圳市市场监督管理局注册登记,取得营业执照,营业执照统一社会信用代码为914403006188155783。 第三条根据《中国共产党章程》规定,设立中国共产党的组织,党委发挥领导核心和政治核心作用,把方向、管大局、保落实。公司要建立党的工作机构,配备足够数量的党务工作人员,保障党组织的工作经费。 第四条公司于一九九一年十一月二十七日经中国人民银行深圳经济特区分行深人银复字(1991)第102号文和深人银复字(1992)第016号文批准,首次向社会公众发行人民币普通股36,500,000股。其中,公司向境内投资人发行的以人民币认购的内资股为26,500,000股, 于一九九二年三月二十七日在深圳证券交易所上市;公司向境外投资人发行的以外币认购并且在境内上市的境内上市外资股为10,000,000股, 于一九九二年三月二十七日在深圳证券交易所上市。 第五条公司注册名称:康佳集团股份有限公司 KONKA GROUP CO., LTD. 第六条公司住所: 深圳市南山区粤海街道科技园科技南十二路28号康佳研发大厦15-24层,邮政编码∶518057。 第七条公司注册资本为人民币2,407,945,408元。 第八条公司为永久存续的股份有限公司。 第九条董事局主席为公司的法定代表人。 第十条公司全部资产分为等额股份,股东以其认购的股份为限对公司承担责任,公司以其全部资产对公司的债务承担责任。 第十一条本公司章程自生效之日起,即成为规范公司的组织与行为、公司与股东、股东与股东之间权利义务关系的具有法律约束力的文件,对公司、股东、董事、监事、高级管理人员具有法律约束力的文件。依据本章程,股东可以起诉股东,股东可以起诉公司董事、监事、总裁和其他高级管理人员,股东可以起诉公司,公司可以起诉股东、董事、监事、总裁和其他高级管理人员。
深康佳A[000016/200016]2019年度财务分析报告 目录 一.公司简介 (3) 二.公司财务分析 (3) 2.1 公司资产结构分析 (3) 2.1.1 资产构成基本情况 (3) 2.1.2 流动资产构成情况 (4) 2.1.3 非流动资产构成情况 (6) 2.2 负债及所有者权益结构分析 (7) 2.2.1 负债及所有者权益基本构成情况 (7) 2.2.2 流动负债基本构成情况 (8) 2.2.3 非流动负债基本构成情况 (10) 2.2.4 所有者权益基本构成情况 (11) 2.3利润分析 (12) 2.3.1 净利润分析 (12) 2.3.2 营业利润分析 (13) 2.3.3 利润总额分析 (13) 2.3.4 成本费用分析 (14) 2.4 现金流量分析 (15) 2.4.1 经营活动、投资活动及筹资活动现金流分析 (15) 2.4.2 现金流入结构分析 (16) 2.4.3 现金流出结构分析 (21) 2.5 偿债能力分析 (25) 2.5.1 短期偿债能力 (25) 2.5.2 综合偿债能力 (26) 2.6 营运能力分析 (27) 2.6.1 存货周转率 (27)
2.6.2 应收账款周转率 (27) 2.6.3 总资产周转率 (28) 2.7盈利能力分析 (29) 2.7.1 销售毛利率 (29) 2.7.2 销售净利率 (30) 2.7.3 ROE(净资产收益率) (31) 2.7.4 ROA(总资产报酬率) (32) 2.8成长性分析 (33) 2.8.1 资产扩张率 (33) 2.8.2 营业总收入同比增长率 (34) 2.8.3 净利润同比增长率 (35) 2.8.4 营业利润同比增长率 (36) 2.8.5 净资产同比增长率 (37)