Header for SPIE use
Landsat 7 Science Data Processing: A Systems Overview
Robert J. Schweiss (*a), Nathaniel E. Daniel (b), Deborah K. Derrick (b)
(a)
Goddard Space Flight Center - Code 586, Greenbelt, Maryland 20771 (b) Computer Sciences Corporation, 7700 Hubble Drive, Lanham-Seabrook, Maryland 20706
ABSTRACT
The Landsat 7 Science Data Processing System, developed by NASA for the Landsat 7 Project, provides the science data handling infrastructure used at the Earth Resources Observation Systems (EROS) Data Center (EDC) Landsat Data Handling Facility (DHF) of the United States Department of Interior, United States Geological Survey (USGS) located in Sioux Falls,South Dakota. This paper presents an overview of the Landsat 7 Science Data Processing System and details of the design,architecture, concept of operation, and management aspects of systems used in the processing of the Landsat 7 Science Data.Keywords: Landsat 7, Data Processing, Science Data Processing, Geometric Processing, Radiometric Processing, Freeware
1.INTRODUCTION
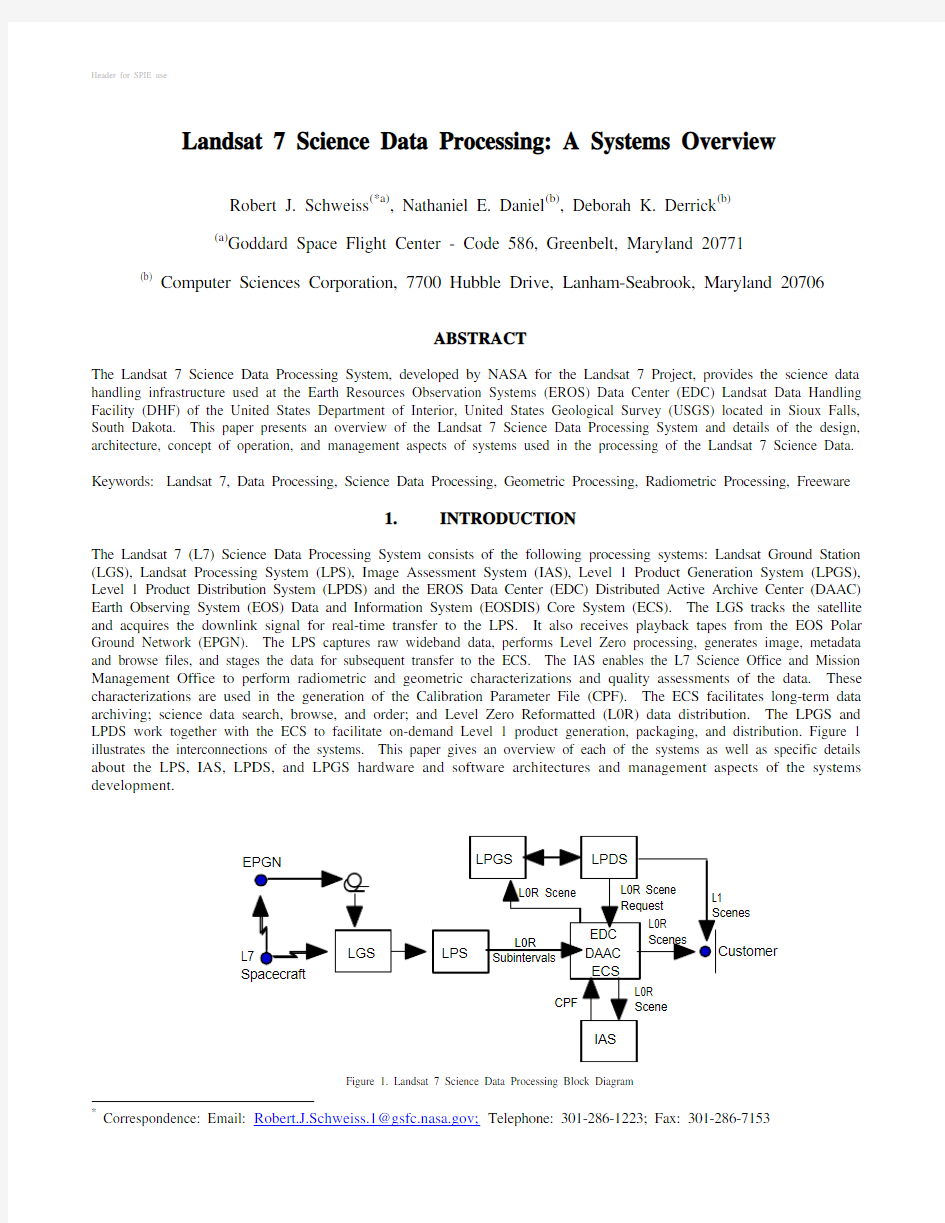
The Landsat 7 (L7) Science Data Processing System consists of the following processing systems: Landsat Ground Station (LGS), Landsat Processing System (LPS), Image Assessment System (IAS), Level 1 Product Generation System (LPGS),Level 1 Product Distribution System (LPDS) and the EROS Data Center (EDC) Distributed Active Archive Center (DAAC)Earth Observing System (EOS) Data and Information System (EOSDIS) Core System (ECS). The LGS tracks the satellite and acquires the downlink signal for real-time transfer to the LPS. It also receives playback tapes from the EOS Polar Ground Network (EPGN). The LPS captures raw wideband data, performs Level Zero processing, generates image, metadata and browse files, and stages the data for subsequent transfer to the ECS. The IAS enables the L7 Science Office and Mission Management Office to perform radiometric and geometric characterizations and quality assessments of the data. These characterizations are used in the generation of the Calibration Parameter File (CPF). The ECS facilitates long-term data archiving; science data search, browse, and order; and Level Zero Reformatted (L0R) data distribution. The LPGS and LPDS work together with the ECS to facilitate on-demand Level 1 product generation, packaging, and distribution. Figure 1illustrates the interconnections of the systems. This paper gives an overview of each of the systems as well as specific details about the LPS, IAS, LPDS, and LPGS hardware and software architectures and management aspects of the systems development. * Correspondence: Email: Robert.J.Schweiss.1@https://www.doczj.com/doc/3412319769.html,; Telephone: 301-286-1223; Fax: 301-286-7153
Figure 1. Landsat 7 Science Data Processing Block Diagram
2. OVERVIEW - LANDSAT GROUND STATION (LGS)
The Landsat Ground Station (LGS) is responsible for acquiring the Enhanced Thematic Mapper Plus (ETM+) X-Band signal from the Landsat 7 spacecraft via any two of the three possible 150-Mbps X-band downlinks. The LGS equipment receives and demodulates each X-band downlink into two 75-Mbps I and Q channels and forwards the data to the LPS. Additionally, the LGS can receive and transmit S-Band telemetry and generate two-way Doppler tracking for each pass. The LGS interfaces with the Mission Operations Center (MOC) for receipt of spacecraft contact schedules and orbital elements, exchange of spacecraft commands and telemetry data, transmission of Doppler tracking data, and forwarding of post pass and equipment status reports.
The LGS antenna system consists of a single 10-meter, S- and X-Band, AZ/EL/Tilt Pedestal antenna, a boresight collimation source, and redundant Low-Noise Amplifiers by Datron. Additionally, it has a 200W S-Band transmitter by Microdyne. The LGS also utilizes X-Band downconverters, demodulators and bit synchronizers, built by Scientific Atlanta, a PC-based Monitor and Control System integrated with FactoryLink COTS software by USDATA Corp., a matrix switch by Matrix Switch, and four DIS 160I recorders by Ampex.
The LGS was designed for minimal operations intervention. Its Monitor and Control System automatically receives spacecraft contact and ephemeris information from the MOC for autonomous station configuration and pass acquisition. During a spacecraft pass the X-band signal is downlinked, demodulated, bit synchronized, and forwarded to the LPS in real-time for raw data capture. The LGS operator, performs pass coordination with the MOC, trouble shoots system anomalies, supports systems contingency procedures, and performs routine system maintenance. Additionally, the LGS operator schedules and loads tapes from the EPGN for data playback from the Ampex recorders to the LGS for subsequent capture and processing by the LPS.
3. OVERVIEW - LANDSAT PROCESSING SYSTEM (LPS)
The Landsat Processing System (LPS) is responsible for raw ETM+ science data capture, Level 0R processing, imagery generation, and the subsequent transfer of all imagery to the ECS for long-term archiving and distribution. The LPS was designed to capture and process the equivalent of 275 scenes (i.e., 140 GB) of science data per day with no more than a 16-hour latency from data acquisition to L0R processing completion.
The major functions of the LPS are summarized as follows:
q Capture Raw ETM+ science data in real-time at 75-Mbps directly to disk
q Synchronize Major Frames and perform error detection and correction1
q Identify subintervals, scenes and scan line offsets
q Generate bands (1-6L, 6H-8), metadata, and browse files
q Perform Cloud Cover Assessment and Scene Quality scoring
q Interface with the ECS for L0R subinterval data transfer and ingest
q Produce real-time moving window display during processing
q Facilitate systems operations, status monitoring, configuration, activity scheduling, and management
3.1 Hardware Architecture
The operational LPS hardware consists of five Silicon Graphics, Inc. (SGI) Challenge XL computers, two Indy workstations, and two X-terminals. Each SGI Challenge XL is configured with eight CPUs, 512 MB of RAM, a VME interface module, a custom built VME-9U-VSIOτ high-speed serial interface board, approximately 178 GB of Ciprico RAID external disk drives, a DLT 4000 library, and a DLT 7000 tape drive. Four of the five SGI systems are required for nominal operations including raw ETM+ data recording, science data processing, and data transfer. The fifth system is a "warm-spare" supporting activities such as training, software maintenance, and testing. The Indy workstations and X-terminals are used as operational terminals supporting the LPS graphical user interfaces and the moving window displays. The custom built VME-9U-VSIO high-speed serial interface board, inserted into each SGI XL VME backplane, accepts as input the 75-Mbps serial differential Note: A valuable tool used to validate the raw ETM+ stream was the DataScope by Jackson and Tull, Seabrook, Md.
τ Note: The VME-9U-VSIO card was built by General Standards Corporation, Huntsville, Alabama
Emitter Coupled Logic (ECL) clock and data signals from the LGS. A SGI developed custom device driver interfaces the VME-9U-VSIO card to the SGI IRIX operating system.
3.2 Software Architecture
The software component of the LPS consists of an Oracle database and seven software subsystems. The seven subsystems are Raw Data Capture, Raw Data Processing, Major Frame Processing, Payload Correction Data Processing, Image Data Processing, Data Transfer, and Process Management and Control. All inter process communication takes place via shared memory or an Oracle database. The user interface is based on Oracle Forms and Menus.
q The Raw Data Capture Subsystem is responsible for capturing raw ETM+ wideband data in real-time to a file for subsequent processing. It generates a raw data file of unsynchronized Consultative Committee for Space Data Systems (CCSDS) major frames and an ASCII metadata file with contact period information in addition to the generation of a data record in the database. The raw data capture process interfaces with a custom device driver developed by SGI that performs direct memory accessing for data ingest and transfer.
q The Raw Data Processing Subsystem accepts the raw data file from the raw data capture subsystem, performs frame synchronization, annotates the channel access data units, performs error detection and correction, generates data quality and accounting statistics, and transfers the data to the major frame processing subsystem
q The Major Frame Processing Subsystem is responsible for identifying a major frame, filling missing frames, determining major frame time and the subinterval, deriving band data offsets, generating the calibration and mirror scan correction data files, extracting the virtual channel data unit status information, extracting payload correction bytes, and generating the quality and accounting data
q The Payload Correction Data Processing Subsystem is responsible for generating the payload correction file, identifying each scene in accordance with the Worldwide Reference System (WRS) on a subinterval basis, and determining the Sun azimuth / elevation, horizontal display shift, and calibration door activity for each scene.
q The Image Data Processing Subsystem is responsible for generating the nine Landsat 7 band files (B1-6L, 6H-8), a browse image, the moving window display for operations, a cloud coverage assessment score, and accounting information that is inserted into the metadata files.
q The Data Transfer Subsystem interfaces with the ECS. It notifies the ECS of data availability, receives the data transfer acknowledgements and deletes data after successful transfer
q The Process Management and Control Subsystem is responsible for all system-level control and monitoring of the LPS devices and processes and provides the interface between the LPS and the operator. It facilitates updating the LPS processing parameters and thresholds, contact schedules, and automatic or manual execution of system tasks such as raw data capture and Level Zero processing.
3.3 Concept of Operations
An operator configures four of the five LPS computers with a daily contact schedule received from the MOC via the shared Oracle database. From this schedule, operational computers automatically perform data capture, processing, and transfer functions. The operator views gross image quality and the progress of the data Level Zero processing with the dynamically updated moving window display.
The nominal data processing flow is as follows: during either real-time contact with the satellite or tape playback the LPS SGI systems record the raw bit stream directly to RAID disk. After the raw data capture event is complete, the LPS initiates Level Zero and Image Processing for L0R subinterval generation. Upon completion of the processing a data-availability-notice is sent to the ECS for data transfer scheduling. When the ECS is ready, it ingests the L0R data subintervals and acknowledges data transfer status to the LPS. In support of potential reprocessing requests each operational LPS SGI makes a short-term copy of the raw data with the DLT 4000 tape library.
3.4 Management Aspects
The LPS project began in June of 1994. It was designed, developed, tested and deployed over a period of approximately 5 years including the last 18 months of maintenance. The LPS software is sized at approximately 100,000 lines of Deliverable Source Instructions (DSI) including C code, header files, and Oracle Forms and Menus. The most significant issue that permeated every facet of the LPS development was the lack of good prelaunch data from the Landsat 7 instrument. As the result of no prelaunch data non-trivial format discrepancies, e.g., extra 0 byte, resulted in significant software changes at a time when development staff profiles were shrinking to maintenance levels. Additionally, some of the LPS capabilities, e.g., cloud cover assessment or WRS accuracy, could not be validated until the spacecraft was on nominal orbit. This necessitated the retention of highly skilled software maintenance personnel, which was incongruent to the staffing budgets. The success of the LPS project is attributed to the patience and thorough testing by operations personnel, industrious and responsiveness of the development personnel, and highly dedicated engineering and development team members.
4. OVERVIEW - IMAGE ASSESSMENT SYSTEM (IAS)
The Image Assessment System (IAS) is responsible for image quality assessment and instrument calibration2. In assessing image quality, IAS monitors and calibrates the radiometric and geometric performance of the ETM+ sensors. The calibration parameters are stored in a Calibration Parameter File (CPF) that is subsequently bundled with the L0R products and distributed by the ECS. Up to 10 L0R images are retrieved from the ECS each day and processed by the IAS to Level 1 radiometrically corrected (L1R) and Level 1 geometrically corrected (L1G) format. The IAS provides the tools needed by the Landsat Mission Management Office to analyze and manage instrument or data format anomalies.
The major functions of the IAS are summarized as follows:
q Assess Landsat 7 image quality to ensure compliance with the radiometric and geometric requirements of the spacecraft and the ETM+ sensor
q Generate Level 1 products that are radiometrically and geometrically corrected
q Compensate for inoperable and saturated detectors, and image artifacts of striping, banding, coherent noise, memory effect, scan correlated shift, and dropped scan lines
q Produce geometric products that have been systematically corrected, precision corrected, and terrain corrected q Produce ETM+ calibration information using Internal Calibrator (IC), Partial-Aperture Solar Calibrator (PASC), and Full-Aperture Solar Calibrator (FASC), and night scene data
q Generate and archive ETM+ trending data for long-term analysis
q Produce radiometric and geometric calibration updates to the CPF
4.1 Hardware Architecture
The operational IAS hardware consists of one SGI Origin 2000 computer and three SGI O2 workstations. The Origin 2000 contains four R10K CPUs, two GB of RAM, and has 288 GBs of Ciprico RAID disk drives attached. The O2 workstations are each equipped with a four GB disk drive, 512MB RAM, and monitors with a 1280x1024 resolution. The Origin 2000 performs all of the processing, and the O2 workstations perform data and image analysis, anomaly investigation, and report generation activities. One of O2 workstations was designed to serve as a system console for the Origin 2000.
4.2 Software Architecture
The IAS software architecture incorporates custom C programming language and several commercial-off-the-shelf (COTS) products. The architecture was designed to minimize IAS software development time. The COTS products include the Oracle Database Management System, Environment for Visualizing Images (ENVI), and Interactive Data Language (IDL). All inter-process communication occurs via the Oracle database or shared memory. The operator user interface is provided through Oracle Forms and the analyst user interface is provided through ENVI and IDL. Hierarchical Data Format (HDF) tools and Application Programming Interfaces (API) are used to read and write the L0R scenes received from the EDC. Adobe FrameMaker is used for producing IAS reports. The IAS software consists of the following subsystems: Process Control, Data Management, Radiometric Processing, Geometric Processing, and Evaluation and Analysis.
q The Process Control Subsystem provides capabilities for planning, monitoring, and controlling work orders. It permits the operator to set up work orders specifying the processing to be performed on the data, to prioritize
the processing to be performed, and to monitor the status of the work order execution. Process Control performs
automated work order execution by monitoring required and available system resources, initiating application
processing, and monitoring application execution status. It controls the execution of radiometric and geometric
processing by initiating and managing the Level 1 processing.
q The Data Management Subsystem ingests, archives, and distributes the IAS data. The data consist of image data, ancillary data, characterization and calibration results, and reports. Data Management transfers data during
ingest using File Transfer Protocol (FTP) functions, stores data in the appropriate internal data stores, updates
data availability information, and manages disk resources. For data export, Data Management performs the
appropriate data formatting and supports the FTP transmission of these data to external systems. The Data
Management software also performs quality checking and L0R correction upon receipt of the data from the
ECS. It prepares data at the start of image processing by correcting the data based on the payload correction
data (PCD) and the mirror scan correction data (MSCD).
q The Radiometric Processing Subsystem performs radiometric calibration and L1R processing. Radiometric calibration determines the calibration in-flight of each detector, that is, the conversion from digital number to
absolute radiance. The primary purpose of the L1R processing is to convert the brightness of the image pixels
to absolute radiance. This process uses various ground- and in-flight-determined calibrations, i.e., Internal
Calibrator, PASC, FASC, and night scenes. Additionally, the Radiometric Processing Subsystem characterizes
the quality and various features of the data, .e.g., inoperable detectors, image artifacts etc.3,4
q The Geometric Processing Subsystem performs geometric calibration and L1G processing. This subsystem processes raw L0R or radiometrically corrected (L1R) imagery into geometrically corrected (L1G) imagery.
Additionally, it characterizes the quality and various features of the data. The L1G image can be processed to
three levels: systematic (L1Gs), precision-corrected (L1Gp), and precision/terrain-corrected (L1Gt).
The IAS Geometric Processing Subsystem was best described by Jim Storey, USGS: "The overall
purpose of the IAS geometric algorithms is to use Earth ellipsoid and terrain surface information in
conjunction with spacecraft ephemeris and attitude data, and knowledge of the Enhanced Thematic
Mapper Plus (ETM+) instrument and Landsat 7 satellite geometry to relate locations in ETM+
image space (band, scan, detector, sample) to geodetic object space (latitude, longitude, and height).
These algorithms are used for purposes of creating accurate Level 1 output products, characterizing
the ETM+ absolute and relative geometric accuracy, and deriving improved estimates of geometric
calibration parameters such as the sensor to spacecraft alignment." 5
q The Evaluation and Analysis Subsystem provides the tools required by the analyst to evaluate and analyze the performance of the ETM+ instrument, perform anomaly investigations, and maintain the CPF. Included are
capabilities for viewing system input, processing reports and results (data analysis, statistical analysis and
trending), and report generation. Additionally, the Evaluation and Analysis tools permit an analyst to invoke
specific aspects of radiometric and geometric processing that perform characterization and calibration functions.
The results of the analysis coupled with trending results are used to update the CPF. The Evaluation and
Analysis capability also provides the analyst capabilities for editing system input and intermediate results and
for submitting processing requests in support of “what if” analysis.
4.3 Concept of Operations
The IAS analyst orders up to 10 L0R products per day from the EDC DAAC for analysis and creates a work order, i.e., procedure for processing a L0R image to a L1 image, for each. The IAS software automatically ingests the L0R data and schedules it for processing according to the work order specifications. It assesses the L0R input data and processes it to L1R and L1G for assessment as L1 products. Image data are assessed with respect to their radiometric and geometric qualities both on an individual product basis and for long-term trend analyses.
The primary product of the IAS is the CPF. As part of this process the IAS submits special imaging requests to the MOC for partial aperture solar calibrator (PASC), full aperture solar calibrator (FASC), or calibration lamp cycling. The IAS analysts use the individual assessments of the L0Rs and the trending data to determine the updates to the CPF and generate reports concerning Landsat 7 instrument performance. These reports, along with an updated CPF when applicable, are provided to
the MOC and the ECS. Users, who order L0R products from the ECS, subsequently receive this CPF file as part of their order.
4.4 Management Aspects
The IAS project began late in 1994 and was reorganized in June 1996 thereby compressing the development phase. In February 1998 Release 2.0 was delivered to operations for acceptance testing. Release 3.0 following in June 1998 and it consisted of 223,000 DSI, which included header files, C source code, Oracle Forms and Menus, IDL, Unix Scripts, and SQL scripts. Between June 1998 and July 1999 one software release and eight patches were generated due to new requirements, data format changes, and software errors adding 1500 DSI to the total. The most significant challenges for the IAS development were the compressed software development schedule coupled with extremely complex scientific algorithms to implement and the lack of L0R scenes to test with. The compressed schedule necessitated tailoring the software development cycle by performing box level testing in lieu of unit testing. The lack of L0R scene data necessitated the development of a complex software testing tool that subsets, extracts, and generates Landsat 7 like Level 0R scenes from Landsat 5 data. The success of the IAS project is attributed to the following: frequent working group meetings (2-3 per week), maintaining strict CM procedures, box level testing in lieu of unit testing, peer software inspections, thorough on-site testing by operations personnel, and highly dedicated and motivated badgeless development teams.
5. OVERVIEW LEVEL 1 PRODUCTION SYSTEMS
The Level 1 production systems consist of two distinct systems: the Level 1 Product Generation System (LPGS) and the Level 1 Product Distribution System (LPDS). The LPGS is responsible for acquiring L0R data associated with the Level 1 orders, performing the requested radiometric and geometric processing, and generating the product in the user-specified format. The LPDS is responsible for receiving the L1 orders from the EDC Billing and Accounting system, prioritizing them for processing, staging the orders for the LPGS, submitting orders for the associated L0R data to the ECS, and generating and distributing the final L1 products.
5.1 Level 1 Product Generation System (LPGS)
The LPGS is a batch-oriented system driven by scripts that generate Landsat 7 Level 1 Products to the specifications provided by the customers. It interfaces with the LPDS and ECS for user product generation requests and data acquisition respectively. It can produce Level 1 products for a WRS scene or a floating subinterval sized between one half scene and three scenes. The LPGS is sized to sustain a daily volume of 100 WRS scene equivalent Level 1 products.
The major functions of the LPGS are summarized as follows:
1.Receive user product generation requests from the LPDS, signal LPDS when to order L0R data, and acquire the
corresponding L0R data from the ECS to process the request
2.Generate 100 L1 WRS scene equivalent products per day in any combination of L1R or L1G products. Format L1R
products in HDF. Format L1G products in FAST-L7A, HDF, or GeoTIFF
https://www.doczj.com/doc/3412319769.html,pensate for inoperable and saturated detectors, and image artifacts of striping, banding, coherent noise, memory
effect, scan correlated shift, and dropped scan lines
4.Produce geometric products that have been systematically corrected with the map projection, (oblique mercator,
universal transverse mercator, lambert conformal conic, transverse mercator, oblique mercator, polyconic, and polar stereographic), resampling method (nearest neighbor, cubic convolution, or modulation transfer function), and
orientation (north up or nominal path) selected by the user
5.1.1 Hardware Architecture
The operational LPGS hardware consists of one SGI Origin 2000 computer and two SGI O2 workstations, and an X-terminal. The Origin 2000 contains 16 R10K CPUs, 24 GB of RAM, and 1.1 TB of Ciprico RAID external disk drives. The X-terminal is used for the operator interface, and the O2 workstations are used for product analysis when necessary. The O2 workstations are equipped with 4 GB disk drives, 512 MB RAM, and monitors with a 1280x1024 resolution. A second SGI Origin 2000 is used for software maintenance and serves as a “cold-spare” to the operational system. It has eight processors, 12 GB of RAM, and 288 GB of external RAID disk drives.
5.1.2 Software Architecture
The LPGS software architecture incorporates custom C software, IAS software reuse, and several COTS products. The COTS products include the Oracle Database Management System, ENVI, and IDL. The LPGS reused IAS’ Radiometric Processing and Geometric Processing Subsystems. Portions of the IAS Process Control and Data Management functions were also reused. The LPGS is similar architecture is similar to that of IAS. However, there are significant differences that reflect the minimal operator intervention criteria of LPGS, as well as the minimal analytical staff. All inter-process communication occurs via the Oracle database, script parameters, or Oracle pipes. The LPGS software consists of the following subsystems: Process Control, Data Management, Radiometric Processing, Geometric Processing, Quality Assessment, and Anomaly Analysis.
q Process Control Subsystem manages LPGS production planning and processing. It automatically takes product generation requests, i.e., specifications for customers order, and initiates monitors, and controls processing.
Additionally, Process Control provides processing status in response to operator requests and manages LPGS
resources for availability.
q Data Management Subsystem maintains and provides access to LPGS data stores. It handles communication protocols with the LPDS and ECS. Data Management ingests and formats files for use by its subsystems,
providing cursory quality checks where needed to ensure the completeness of received and prepared products.
It also provides formatting and packaging of L1 output and makes these data available to the LPDS.
q Radiometric Processing Subsystem is reused from the IAS. The LPGS does not utilize all of the radiometric algorithms because it does not collect calibration data, nor does LPGS process PASC or FASC data. LPGS
Radiometric Processing provides the results of characterizations performed and the processing status for use by
IAS and the Quality Assessment Subsystem.
q Geometric Processing Subsystem is reused from the IAS Geometric Processing Subsystem. It creates systematically corrected L1G imagery from L1R products. However, it does not perform terrain or precision
correction, nor are calibration data produced.
q Quality Assessment Subsystem generates and assembles postproduction information about image artifacts and effects that were not corrected, and it produces a summary of the processed image quality. It performs
automated quality assurance after radiometric and geometric corrections of images have been made.
Additionally, the Quality Assessment software provides capability for visual inspection of images after
radiometric correction, geometric correction, and final product formatting.
q Anomaly Analysis Subsystem analyzes L1 images and associated post production information to resolve image production anomalies. Typically the focus is on L0R products that could not be successfully processed to L1 or
that failed visual inspection. Additionally, using baselined L0R products, Anomaly Analysis permits an analyst
to perform benchmark tests to confirm the integrity and performance of the LPGS after any system upgrades.
5.1.3 Concept of Operations
The LPGS automatically produces L1 images as user requests are received from the LPDS. When resources are available the LPGS notifies the LPDS to post orders for L0R products in electronic format from the ECS. The LPDS receives notification of data availability and subsequently informs the LPGS for L0R data acquisition. The acquired L0R product is processed to L1 as specified by the user (e.g., Level 1G, GeoTIFF, space oblique mercator map projection, resampling method, etc.). During processing selected trending statistics are recorded for subsequent retrieval and processing by the IAS. LPDS retrieves the L1 product from the LPGS, copies it to appropriate media, validates it, and notifies the LPGS of completion for subsequent file deletion. The LPGS system may be configured for manual visual quality inspection if necessary.
5.1.4Management Aspects
Development of the LPGS began in August 1996, and with delivery of Release 3.0, in January 1999, all requirements had been implemented. Several maintenance deliveries followed that reflected changes in LPGS requirements, identified errors,
and changes in data format. When LPGS became operational, it totaled close to 220,000 DSI which included header files, C code, Oracle Forms and Menus, IDL, UNIX scripts, and SQL scripts. Of the 220,000 DSI, almost 135,000 are attributable to re-use of IAS, including radiometric and geometric processing software.
The significant challenges for the development of the LPGS were the reuse of the IAS Radiometric and Geometric software subsystems and the late change in external interface requirements from ECS to LPDS. LPGS maximized the reuse of the IAS software but the LPGS' schedule was significantly behind the IAS, which made it very difficult to influence key requirements decisions. Often times circumstances did not permit reuse improvement changes to the IAS hence translation software was generated that reformatted user supplied processing parameters so that the radiometric and geometric subsystems could use it. Additionally, the LPDS was added in lieu of ECS in an effort to reduce the schedule for Level 1 product media generation and distribution to the launch plus 90 days time frame. The LPGS-ECS interface was replaced with the LPGS-LPDS interface necessitating a significant amount of software rework. In retrospect the success of the project can be attributed to highly dedicated professionals.
5.2 Level 1 Product Distribution System (LPDS)
The Level 1 Product Distribution System (LPDS) is the "middle man" of all Level 1 processing. It interfaces with the EDC billing and accounting system for receipt of approved data orders, the ECS for L0R data ordering, and the LPGS for L1 processing. It contains custom software for managing the data orders, utilizes the EDC-built Product Distribution System (PDS) for media generation, and has a stand along server / application called the DAAC L1 Server for the handling of L1 data searches, browse requests, and orders as the ECS only recognizes orders for L0R data. All Level 1 product generation is performed in an "on-demand" first-in-first-out basis, assuming resource availability. The LPDS was designed to sustain the production of the equivalent of 100 WRS scenes per day.
The major functions of the LPDS are summarized as follows:
q Facilitate the generation of Level 1 products and distribute them electronically or in 8-mm or CD-ROM
q Interface with the EDC billing and accounting system for receipt of L1 orders and status reporting
q Coordinate generation of Level 1 products with the LPGS
q Provide product status information to EDC User Services
q Bridge Landsat 7 Level 1 inventory searches and orders from the V0 IMS Client to the L0R based ECS
5.2.1Hardware Architecture
The operational LPDS hardware consists of one SGI Origin 2000 computer, an SGI Origin 200 computer, a SGI O2 workstation, two Rimage CD-RW Super Producers, several X-terminals, two networked Genicom label printers, and a Tektronix Phaser 740 Color Laser Printer. The SGI Origin 2000 has four R10K CPUs, 768 MB RAM, and externally connected 216 GB of Ciprico RAID disks, six 8mm tape drives, and eight CD-R readers. The Origin 200 has one R10K CPU, 640 MB of RAM, and 288 GB of Ciprico RAID disks connected to it. The Rimage Super Producers consist of a Pentium II PC coupled to a CD picker with four CD-RWs. The Super Producers can load, burn, and label CDs automatically and can hold up to 50 CDs at a time. The Origin 2000 is the backbone of all processing and the Origin 200 server supports the electronic file distribution. The SGI O2 workstation serves as a system console for the Origin systems and the X-terminals support the operator interfaces. The Color Laser Printer is used to generate a full-color thumbnail image of the user's product on the CD-ROM cover. The system was designed to produce a maximum of 200 CD-ROMs, 50 8-mm tapes, or stages 50 electronic files for transfers per day such that any combination of the media counts does not exceed the equivalent of 100 WRS scene products per day.
5.2.2 Software Architecture
The LPDS software incorporates custom C programming language with embedded Oracle SQL and Forms and the existing EDC-built Product Distribution System (PDS). The LPDS subsystems are the Order Manager, Acquire Manager, Ingest Manager, Product Distribution System, the Operator Interface, and the DAAC L1 Server.
q The Order Manager Subsystem captures, validates, and acknowledges L1 orders sent from the billing and accounting system and queues the order information for retrieval by the LPGS
q The Acquire Manager Subsystem coordinates L0R data ordering between the LPGS and ECS such that ordering only occurs when the LPGS is ready for more data. Additionally, order identification keys from the ECS and the billing and accounting system are collated to ensure product traceability
q The Ingest Manager Subsystem coordinates between the LPGS and the PDS for the production of the final product
q The Product Distribution System Subsystem copies the Level 1 products to 8-mm tape, or CD-ROM or stages the data for electronic transfer to the user
q The Operator Interface Subsystem uses Oracle Forms to provide a menu-driven graphical user interface facilitating the management of all subsystems including order monitoring, promoting, resetting, and canceling
q DAAC L1 Server Subsystem hides the details of the handling of the Level 1 products from the L0 based ECS by intercepting and converting Level 1 directory and inventory searches, browse requests, and product orders to L0R directory and inventory searches, browse requests, and product orders. It also handles the conversion of L0R inventory searches to L1 directory and inventory search results and forwards the browse images.
5.2.3 Concept of Operations
Via the EOS V0 IMS? web interface a customer searches and browses the Landsat archives at the EDC DAAC and submits an order for a Level 1 product. The order is sent to the EDC User Services for validation and approval. Upon approval the order is forwarded to the LPDS for processing via the billing and accounting system.
The LPDS autonomously waits for the EDC billing and accounting system to send orders. All orders received by the LPDS are stored in a Level 1 order queue and passed to the LPGS based on a first-in-first-out basis, subject to media quotas and operator override direction. The orders progress through several intermediate processing queues as the associated L0R data are ordered, acquired, processed by the LPGS, and processed by the PDS. The LPGS stages the Level 1 products on its disk drives until the PDS copies the files, generates the specified media, and verifies the media. The operator manually loads and unloads tapes and CD-ROMs as prompted by the PDS for product verification. Additionally the operator collates media, labels, and delivery letters. Finally, the billing and accounting system is notified of order completion.
5.2.4Management Aspects
Development of the LPDS began January 1998 and a launch ready version was delivered in February 1999. Release 2.0B was delivered to operations July 1999, and the final release was delivered in August 1999. The LPDS was designed, developed, and tested over a period of 20 months. Approximately 35,000 DSI, not counting the PDS, were developed, adapted, or converted during that period. The most significant challenge for the development of the LPDS was the compressed schedule coupled with a large number of external interfaces. The success of the project is attributed to strict requirements control, simplification of interfaces, close collaboration with knowledgeable EDC DAAC development personnel, utilization of Landsat cognizant personnel, early software prototyping of key functions, and reusing the EDC-built PDS.
6. OVERVIEW - EDC DAAC ECS
The EDC provides one of eight DAACs of the Earth Observing System6 (EOS) Data and Information System (EOSDIS). EOSDIS is one of the major elements of the EOS Program, a principal element of the Earth Science Enterprise (ESE). ESE is a long-term NASA research mission designed to improve our understanding of the Earth's interrelated processes involving the atmosphere, oceans, land surfaces, and polar regions7. EOSDIS is an end-to-end data system that include flight operations, data acquisition, data capture, initial processing, and backup archival. Data are routed to the DAACs and further processed into products for archival and distribution. Landat 7 only uses the DAAC portion of the EOSDIS for archival and distribution of data. Specifically, the data are held in the EOSDIS Core System (ECS).
? See following URL for ordering L7 data https://www.doczj.com/doc/3412319769.html,/~imswww/pub/imswelcome/
The ECS performs the following functions for Landsat: long-term data archiving, scene subsetting, and WRS L0R scene distribution. It also supports data search, browse, and order capabilities and interfaces with the LPS, IAS, and Level 1 processing systems. The EDC DAAC holds the data for the Landsat 7, MODIS/Aster, Terra (AM-1), and Aqua missions. The Landsat 7 related functions of the ECS are summarized as follows:
q Interface with the LPS for receipt and archive of L0R subintervals, browse images, and associated metadata
q Correlate Landsat Format 1 and Format 2 subintervals during data ingest process
q Interface with International Ground Stations for receipt of browse images and metadata
q Receive, archive, and distribute the Landsat 7 CPF from the IAS
q Report WRS scenes archived and associated cloud coverage score to GSFC MOC
q Interface with the EDC Billing and Accounting system
q Support customer search, browse, and order capabilities through EOSDIS Data Gateway
q Perform scene subsetting on a WRS boundary
q Ingest a maximum of 140 GB of data from the LPS and up to 110 distribute 110 L0R products per day to the Level 1 Processing systems or customers.
The ECS interfaces with the LPS for ingest of the processed Landsat 7 L0R subintervals, associated metadata, and browse images. A subset of the metadata and the browse images are aggregated into a database for search, browse, and order support. The EDC DAAC copies the data from the various LPS systems after notification of data availability is received. During the ingest and archive process the ECS must correlate the format 1 and format 2 subintervals because the data are received from independent computers within the LPS. When a scene is ordered the subinterval is recalled from off-line storage and staged for scene subsetting and subsequent L0R product generation, i.e., 8-mm tape or electronic transfer.
7. SUMMARY
The Landsat 7 Science Data Processing System went operational several days after spacecraft launch on April 15, 1999. The EDC DAAC began selling Landsat L0R and L1 products in the fall of 1999. In 24 hours the Science Data Processing System can capture and archive the equivalent of 275 WRS scenes and can distribute the equivalent of 100 WRS L0R or L1 scenes. The success of the Science Data Processing System is attributed to the dedicated professionals who developed and operate the systems. The systems are currently in operation at the EROS Data Center under the auspices of the USGS, Department of the Interior8. The LPS=, IAS, and LPGS software are available as freeware via the following methods. The LPS and LPGS software is available upon request from the L7 Program Manager. Please direct your inquires to the L7 Program Manager, EROS Data Center, U.S.Geological Survey, 47914 252nd St. Sioux Falls, SD., 57198. The IAS software may be obtained on line via https://www.doczj.com/doc/3412319769.html,/ under the Technical Information and IAS Software Registration popup menu items. A PC adapted version of the LPGS called LPGS-LITE is available via the Open Source Remote Sensing (OSRS) web server at https://www.doczj.com/doc/3412319769.html,/. The COTS products used by these systems may be licensed from the applicable vendors.
REFERENCES
1.Steve Duran, et al, "The GLOBE program and Software Based Telemetry processing", International Symposium on
Reducing the Cost of Spacecraft Ground Systems and Operations, 27-29 September, 1995
2. B. L. Markham, W.C. Boncyk, D. L. Helder and J. L. Barker, Landsat-7 Enhanced Thematic Mapper Plus Radiometric
Calibration, Canadian Journal of Remote Sensing: Vol. 23, No. 4, December 1997
3.National Aeronautics and Space Administration (NASA), Goddard Space Flight Center (GSFC), 514-3SUG/0197,
Landsat 7 Image Assessment System (IAS) User’s Guide, Release 3.2, July 1999, Section E.5
4.Radiometric Processing Flows, February 1997, https://www.doczj.com/doc/3412319769.html,/LANDSAT/IAS_RAD_ALGO/
https://www.doczj.com/doc/3412319769.html,ndsat 7 Image Assessment System (IAS) Geometric Algorithm Theoretical Basis Document July 9, 1998, Version 3.2,
https://www.doczj.com/doc/3412319769.html,/IAS/pdfs/Atbdver3.2.PDF
6.NASA Earth Observing System, [home page]: https://www.doczj.com/doc/3412319769.html,/
7.Michael D. King, Reynold Greenstone, 1999 EOS Reference Handbook, A Guide to NASA’s Earth Science Enterprise
and the Earth Observing System, https://www.doczj.com/doc/3412319769.html,/eos_homepage/misc_html/refbook.html
= Note: The LPS VME-9U-VSIO device driver is not available as freeware.
8.U.S. Geological Survey, 1999, Landsat 7, [home page]: Sioux Falls, South Dakota, USGS EROS Data Center, electronic
version, https://www.doczj.com/doc/3412319769.html,/
期刊影响因子的“含金量”是多少 这是一个以标准衡量的世界。既然吃饭都有米其林餐厅评级作为参考,更何况严谨的学术科研成果。 期刊影响因子长久以来被学术界视为一个重要的科研水平参考指标。在一本影响因子高的期刊发表论文,科研人员的科研能力和成果也更容易获得认同。然而,部分科学家已对这一指标能否真正反映单篇论文乃至作者学术水平提出质疑,加上每年发布这一指标的汤森路透公司在本月早些时候宣布把相关业务转售给两家投资公司,影响因子未来能否继续维持其「影响力」令人存疑。 广泛影响 根据汤森路透发布的信息,该公司已同意将旗下知识产权与科学业务作价35.5亿美元出售给私募股权公司Onex和霸菱亚洲投资。这一业务包括了世界知名的科技文献检索系统「科学引文索引」(简称SCI)以及定期发布的《期刊引证报告》,其中的期刊影响因子是一本学术期刊影响力的重要参考。 新华社记者就此事咨询了汤森路透,该公司一位发言人说,这一交易预计今年晚些时候完成,在此之前该公司还会继续拥有并运营这项业务,「我们将在不影响这项业务开展和质量的前提下完成交易」。 帝国理工学院教授史蒂芬·柯里接受记者采访时说,他对汤森路透用来计算期刊影响因子所使用的数据是否可靠本来就有一定顾虑,「我不确定汤森路透的这次交易是否产生影响,但这项业务的接盘方如果未来能够保证这方面的透明度也是一件好事」。 影响因子的计算方法通常是以某一刊物在前两年发表的论文在当年被引用的总次数,除以该刊物前两年发表论文的总数,得出该刊物当年的影响因子数值。理论上,一种刊物的影响因子越高,影响力越大,所发表论文传播范围也更广。鉴于全球每个科研领域中都有大量专业期刊,如果有一个可靠的指标能告诉研究人员哪个期刊影响力更大,他们就能更高效地选择在一个高质量平台上发表科研成果。 但这又引申出一个现象,即许多科研机构、高校甚至学术同行越来越依赖影响因子来评判一篇论文甚至作者本身的科研水平,进而影响他们的职称评定和获取科研项目资助等机会。 业内争议 这种过度依赖影响因子的做法引起不少业内争议。来自帝国理工学院、皇家学会等科研机构学者以及《自然》《科学》等期刊出版方的高级编辑,合作撰写了一份报告分析其中弊端,并提出相关改进方案。这篇报告已在近期被分享到一个公开的预印本服务器上供同行审阅。 报告分析了包括《自然》《科学》在内11份学术期刊在2013年至2014年间所刊发论文被引用次数的分布情况,这些数据也您身边的论文好秘书:您的原始资料与构思,我按您的意思整理成优秀论文论著,并安排出版发表,企鹅1550116010自信我会是您人生路上不可或缺的论文好秘书被用来计算2015年相关刊物的影响因子。 报告作者发现,多数论文被引用次数都达不到发表它们的期刊的影响因子数值水平,比如《自然》在这期间所刊发论文中的74.8% 在2015年获得的引用次数就低于这本期刊当年影响因子所显示的水平,《科学》的情况也类似。报告说,这主要是因为这些期刊中有一小部分论文被引用次数非常高,导致影响因子在均值计算过程中出现偏差。 报告详细描述了如何更准确地计算出期刊所刊发论文被引用次数的分布状况,并呼吁各家期刊将这些基础数据公布出来,减少学术界对影响因子的过度依赖。
提高学术期刊影响因子的途径 作者:李勤来源:《今传媒》 美国科技信息研究所所长尤金?加菲尔德首先用论文的被引证频次来测度期刊的影响力,1963年美国科技信息研究所正式提出和使用影响因子这一术语。期刊在某年的影响因子是指该刊前两年发表论文在统计当年被引用的总次数除以该刊前两年发表论文的总数。由影响因子的定义可知,期刊的影响因子反映在一定时期内期刊论文的平均被引率。影响因子的三个基本要素是论文量、时间和被引次数,也就是说,期刊所刊发论文的被引情况决定了该期刊的影响因子。总的说来,一篇论文的被引次数越多,说明它的学术影响力越大,同样也表明它的学术质量较高、创新性较强。因为影响因子高的期刊具有较广泛的读者群和比较高的引用率。影响因子的高低客观地反映了期刊和编辑吸引高质量稿件的能力。所以,我们在评价期刊时,影响因子为重要的评价指标之一。许多作者在投稿时,也将影响因子高的期刊作为投稿首选。图书馆或研究院、资料室在选择订阅期刊或优化馆藏期刊时,也把期刊的影响因子作为重要的参考标准之一。而且影响因子也是筛选中文核心期刊的一项重要指标。因此,作为期刊工作者,努力提高期刊的影响因子十分必要。分析学术期刊的计量指标情况,决定影响因子高低的因素通常有这样几点: 一、影响因子的影响因素 一是论文发表时滞。论文发表时滞(DPA)是指期刊论文的出版日期与编辑部收到该文章的日期之时间差,以月为单位。它是衡量期刊时效性的重要指标,与期刊的影响因子和被引频次有密切关系。因为在计算影响因子时,期刊被引频次中两年的时间限制可导致不同刊物中论文的被引证次数有较大的差异。出版周期短的刊物更容易获得较高的影响因子。因而在同一学科领域的研究论文,特别是研究热点领域内的论文,首先被公开发表的论文更有可能引起较大的影响或者被别人引证。 二是论文学术水平。论文的学术质量直接制约着期刊影响因子的提高。学术质量较高的论文,容易被同行认可,引用率自然就高,影响因子也高。相反,学术质量较差的论文,不会被同行认可,得不到同行研究者的重视,引用率自然就低,影响因子也较低。在各类文章中,具有原创性的学术论文常常被研究人员参考和引用。同时有争议的学术讨论更容易获得同行的广泛关注,而普通的介绍性论文则不太被人们关注。 三是参考文献的数量和质量。由于影响因子是根据期刊的引文计算出来的,通常参考文献的内容越新颖,信息质量越高,影响因子就越高。准确的参考文献有助于作者在有限的篇幅中阐述论文的研究背景及其相关的观点和论据。同时可以方便读者追溯有关的参考资料进一步研究问题。统计分析表明,期刊的影响因子主要取决于论文的平均引文数、引证半衰期及论文的被引证率。所以,参考文献数量较多的论文它的平均引文数量就比较大,而且参考文献越准确,读者查阅参考文献就更方便,读者能分享文献信息资源就越多。 根据我们的分析研究,提高学术期刊影响因子,应该在以下几个方面用功夫: ⒈鼓励高质量论文在我国首先发表
【自然科学】材料期刊排名及影响因子 Nature 自然31.434 Science 科学28.103 Nature Material 自然(材料)23.132 Nature Nanotechnology 自然(纳米技术)20.571 Progress in Materials Science 材料科学进展18.132 Nature Physics 自然(物理)16.821 Progress in Polymer Science 聚合物科学进展16.819 Surface Science Reports 表面科学报告12.808 Materials Science & Engineering R-reports 材料科学与工程报告12.619 Angewandte Chemie-International Edition 应用化学国际版10.879 Nano Letters 纳米快报10.371 Advanced Materials 先进材料8.191 Journal of the American Chemical Society 美国化学会志8.091 Annual Review of Materials Research 材料研究年度评论7.947 Physical Review Letters 物理评论快报7.180 Advanced Functional Materials 先进功能材料 6.808 Advances in Polymer Science 聚合物科学发展 6.802 Biomaterials 生物材料 6.646 Small 微观? 6.525 Progress in Surface Science 表面科学进展 5.429 Chemical Communications 化学通信 5.34 MRS Bulletin 材料研究学会(美国)公 告 5.290 Chemistry of Materials 材料化学 5.046 Advances in Catalysis 先进催化 4.812 Journal of Materials Chemistry 材料化学杂志 4.646 Carbon 碳 4.373 Crystal Growth & Design 晶体生长与设计 4.215 Electrochemistry Communications 电化学通讯 4.194 The Journal of Physical Chemistry B 物理化学杂志,B辑:材 料、表面、界面与生物物 理 4.189 Inorganic Chemistry 有机化学 4.147 Langmuir 朗缪尔 4.097 Physical Chemistry Chemical Physics 物理化学 4.064 International Journal of Plasticity 塑性国际杂志 3.875 Acta Materialia 材料学报 3.729 Applied Physics Letters 应用物理快报 3.726 Journal of power sources 电源技术 3.477 Journal of the Mechanics and Physics of Solids 固体力学与固体物理学 杂志 3.467
经济学 排名期刊名称主办单位刊号2010年2011年2012年2013年(五年)四年平均值1经济研究中国社会科学院经济研究所CN11-1081/F9.838.60911.55514.45311.112 2会计研究中国会计学会CN11-1078/F8.983 5.9097.0849.0357.753 3经济学(季刊)北京大学中国经济研究中心CN 11-6010/F—— 4.703 4.267 5.386 4.785 4金融研究中国金融学会CN11-1268/F 5.003 3.423 4.669 5.902 4.749 5中国工业经济中国社会科学院工业经济研究所CN11-3536/F 4.797 4.073 3.814 5.644 4.582 6世界经济中国社会科学院世界经济与政治研究所CN11-1138/F 4.535 3.557 3.965 5.742 4.450 7数量经济技术经济研究数量经济与技术经济研究所CN11-1087/F 3.307 3.988 4.318 4.961 4.144 8国际金融研究中国国际金融学会CN11-1132/F 5.326 3.170 3.389 3.066 3.738 9审计研究中国审计学会CN11-1024/F 3.573 2.560 3.878 4.486 3.624 10中国农村经济中国社会科学院农村发展研究所CN11-1262/F 3.341 3.018 3.417 3.782 3.390 11中国农村观察中国社会科学院农村发展研究所CN11-3586/F 2.673 2.193 2.750 4.628 3.061 12财经研究上海财经大学CN31-1012/F 3.135 2.258 2.589 3.223 2.801 13农业经济问题中国农业经济学会CN11-1323/F 2.854 2.478 2.425 3.200 2.739 14中国土地科学中国土地学会、中国土地勘测规划院CN11-2640/F 2.402 2.675 2.518 2.999 2.649 15国际经济评论中国社会科学院世界经济与政治研究所CN11-3799/F 3.753 2.385 2.285 2.143 2.642 16世界经济研究上海社会科学院世界经济研究所CN31-1048/F 3.308 2.473 2.188 2.395 2.591 17国际贸易问题对外经济贸易大学CN11-1692/F 2.905 2.477 2.242 2.690 2.579 18经济科学北京大学CN11-1564/F 3.083 1.968 2.185 3.065 2.575 19南开经济研究南开大学经济学院CN12-1028/F 2.508 1.323 2.424 3.025 2.320 20农业技术经济中国农业技术经济研究会CN11-1883/S 2.221 1.798 1.901 2.549 2.117 21世界经济文汇复旦大学CN31-1139/F 2.143 1.453 2.245 2.596 2.109 22财贸经济中国社会科学院财经战略研究院CN11-1166/F 2.059 1.533 2.240 2.560 2.098 23经济学家西南财经大学CN51-1312/F 2.08 1.593 2.347 2.303 2.081 24经济理论与经济管理中国人民大学CN11-1517/F 2.272 1.718 2.075 2.172 2.059 25证券市场导报深圳证劵交易所综合研究所CN44-1343/F 2.641 1.602 1.687 2.142 2.018 26产业经济研究南京财经大学CN32-1683/F 1.783 1.763 2.153 2.283 1.996 27经济评论武汉大学CN42-1348/F 1.944 1.673 2.013 2.113 1.936 28国际贸易中国商务出版社CN11-1600/F 2.774 2.023 1.542 1.363 1.926 29财经科学西南财经大学CN51-1104/F 2.179 1.584 1.673 1.768 1.801 30当代经济科学西安交通大学CN61-1400/F 1.944 1.447 1.675 2.093 1.790 31现代日本经济吉林大学、全国日本经济学会CN22-1065/F 1.8 1.863 1.829 1.414 1.727 32财经问题研究东北财经大学CN21-1096/F 1.965 1.317 1.567 1.933 1.696 33财经理论与实践湖南大学CN43-1057/F 2.032 1.530 1.460 1.743 1.691 34城市发展研究中国城市科学研究会CN11-3504/TU 1.448 1.569 1.822 1.896 1.684 35审计与经济研究南京审计学院CN32-1317/F 1.42 1.413 1.859 2.002 1.674 36当代财经江西财经大学CN36-1030/F 1.774 1.468 1.685 1.747 1.669 37南方经济广东经济学会、广东省社会科学院CN44-1068/F 1.773 1.181 1.589 2.094 1.659 38上海财经大学学报上海财经大学CN31-1817/C 1.88 1.380 1.658 1.687 1.651 39宏观经济研究国家发展和改革委员会宏观经济研究院CN11-3952/F 1.915 1.535 1.625 1.460 1.634 40商业经济与管理浙江工商大学CN33-1336/F 1.738 1.235 1.458 1.803 1.559 41山西财经大学学报山西财经大学CN14-1221/F 1.594 1.277 1.602 1.724 1.549 42经济与管理研究首都经济贸易大学CN11-1384/F 1.769 1.287 1.382 1.617 1.514 43上海经济研究上海社会科学院经济研究所CN31-1163/F 1.357 1.424 1.658 1.554 1.498 44经济社会体制比较世界发展战略研究部CN11-1591/F 1.501 1.174 1.561 1.649 1.471 45税务研究中国税务杂志社CN11-1011/F 1.779 1.133 1.611 1.360 1.471 46世界经济与政治论坛江苏省社会科学院世界经济研究所CN32-1544/F 1.886 1.442 1.288 1.207 1.456 47中央财经大学学报中央财经大学CN11-3846/F 1.605 1.253 1.349 1.508 1.429 48城市问题北京市社会科学院CN11-1119/C 1.677 1.273 1.218 1.484 1.413 49中南财经政法大学学报中南财经政法大学CN42-1663/F 1.336 1.160 1.517 1.628 1.410 50财贸研究安徽财经大学CN34-1093/F 1.256 1.194 1.524 1.637 1.403 51经济问题探索云南省发展和改革委员会CN53-1006/F 1.433 1.108 1.320 1.294 1.289 52国际经贸探索广东外语外贸大学CN44-1302/F 1.5820.987 1.110 1.249 1.232 53财经论丛浙江财经大学CN33-1154/F0.759 1.147 1.376 1.614 1.224 54金融经济学研究广东金融学院CN44-1696/F 1.139 1.130 1.252 1.252 1.193 55国际商务(对外经济贸易大学学报)对外经济贸易大学CN11-3645/F 1.15 1.150 1.296 1.163 1.190 56农村经济四川省农业经济学会CN51-1029/F 1.2570.981 1.220 1.269 1.182 57江西财经大学学报江西财经大学CN36-1224/F0.9310.872 1.370 1.291 1.116 58财政研究中国财政学会CN11-1077/F 1.0950.994 1.185 1.173 1.112 59现代经济探讨江苏省社会科学院CN32-1566/F 1.0120.994 1.346 1.088 1.110 60经济学动态中国社会科学院经济研究所CN11-1057/F 1.1370.914 1.126 1.197 1.094 61经济经纬河南财经政法大学CN41-1421/F 1.0860.884 1.141 1.239 1.088 62改革重庆社会科学院CN50-1012/F——0.503 1.161 1.591 1.085 63亚太经济福建社会科学院CN35-1014/F 1.4530.9160.9550.990 1.079 64经济纵横吉林省社会科学院CN22-1054/F 1.1880.963 1.107 1.044 1.076 65经济问题山西省社会科学院CN14-1058/F 1.1690.8940.995 1.068 1.032 66云南财经大学学报云南财经大学CN53-1209/F 1.2010.8010.8660.9110.945 67当代经济研究吉林财经大学CN22-1232/F0.9570.8230.9940.9260.925 68广东财经大学学报广东财经大学CN44-1446/F0.8640.8000.9110.8420.854 69河北经贸大学学报河北经贸大学CN13-1207/F0.7510.7390.7760.8640.783 70中国经济问题厦门大学经济研究所CN35-1020/F0.7190.3330.5820.8530.622 71价格理论与实践中国价格协会CN11-1010/F0.6860.5130.6900.5610.613 72中国社会经济史研究厦门大学历史研究所CN35-1023/F0.4960.3950.5290.5020.481 73政治经济学评论中国人民大学CN11-5859/D—————————— 以下为CSSCI扩展版来源期刊 排名期刊名称主办单位刊号2010年2011年2012年2013年(五年)四年平均值1金融评论中国社会科学院金融研究所CN11-5865/F—————— 1.778 1.778 2金融论坛城市金融研究所、中国城市金融学会CN11-4613/F 2.348 1.083 1.000 1.504 1.484 3上海金融上海市金融学会CN31-1160/F 1.801 1.251 1.390 1.215 1.414 4技术经济中国技术经济学会CN11-1444/F 1.138 1.135 1.219 1.264 1.189 5现代城市研究南京城市科学研究会CN32-1612/TU 1.1680.916 1.295 1.333 1.178 6税务与经济吉林财经大学CN22-1210/F 1.225 1.113 1.212 1.001 1.138 7消费经济湘潭大学、湖南商学院、湖南师范大学CN43-1022/F 1.215 1.041 1.165 1.129 1.138 8保险研究中国保险学会CN11-1632/F0.839 1.069 1.408 1.152 1.117
中国学术期刊影响因子年报、国际引证报告发布 王保纯 2012年12月28日07:59 来源:光明日报 中国学术期刊电子杂志社、中国科学文献计量评价研究中心与清华大学图书馆26日共同发布了《中国学术期刊影响因子年报(2012版)》和《中国学术期刊国际引证报告(2012版)》,同时还首次发布了2012年度中国最具国际影响力学术期刊和中国国际影响力优秀期刊,科技界和社科界418个学术期刊分别入选两个名单。 此前,我国对于学术期刊国际影响力的评价,多以SCI(科学引文索引)、SSCI(社会科学引文索引)等国际权威检索机构收录与否作为唯一衡量标准,很多未被收录期刊往往不被看好。《中国学术期刊国际引证报告》的发布是我国学术期刊乃至学术评价领域的一个突破性进展,是我们国家,也是国际上第一次从文献计量的角度,全面、系统、深入地向社会揭示中国学术期刊走向世界取得的成果和存在的问题。此举标志着我国学术期刊有了统一的国际影响力认证标识。 中国科学文献计量评价中心主任杜文涛介绍了此次研究的有关情况。他说,中国最具国际影响力学术期刊和中国国际影响力优秀期刊,是依据《中国学术期刊国际引证报告(2012版)》,按2011年度中国学术期刊被SCI期刊、SSCI期刊引用的总被引频次和影响因子排序,经综合计算,并经40多位期刊界专家审议,最终遴选出的TOP5%期刊和TOP5%-10%期刊。在中国最具国际影响力学术期刊中,科技期刊备选3533种,由上述方法选出175种;人文社科类备选680种,选出34种,共计209种。同样,在中国国际影响力优秀期刊中,由上述方法选出科技类期刊和人文社科类期刊也分别为175种和34种,共计209种。参与报告研制的研究人员惊喜地发现,不少非SCI、SSCI收录期刊比SCI、SSCI收录期刊具有更高的被引用次数。在上榜的418个期刊中,中文期刊达312个。
《中国学术期刊影响因子年报》评价指标体系 1.期刊影响力综合评价指标——期刊影响力指数(CI ) 统计某个年度内出版的某些源文献引证期刊的次数,可以在统计学意义上反映期刊在该统计年度产生的影响力。简单而常用的计量指标有期刊的总被引频次(TC ,广延量,评价对象为期刊已发表的所有文献)、影响因子(IF ,强度量,评价对象为期刊在统计年之前两年发表的文献)、即年指标(强度量,评价对象为期刊在统计年发表的文献)等。 显然,上述指标的评价对象是期刊在不同时期发表的文献,且评价角度、计量方法各不相同,任一指标都不能全面反映期刊的影响力。期刊评价中片面强调其中某个指标,都会导致期刊出现片面发展倾向,甚至引发期刊的学术不端行为,干扰期刊正常发展。因此,人们一直在希望找到一个综合反映期刊影响力的计量指标。然而,过去这方面的工作总是试图将TC 、IF 等指标先验地假设为同一线性空间的可加标量,按一组人为设定的权重参数拟合为一个“综合指标”,而未注意区分这些指标的内禀属性,得到的期刊排序结果也难以给予合理的解释。 我们在2013年首次提出了一种综合评价学术期刊影响力的方法,连续三年应用于“中国最具国际影响力学术期刊”的遴选,基本原理、计算方法和结果得到了国内外学术界和期刊界的基本认可。 1.1期刊影响力指数(CI )的基本定义 定义1:期刊影响力排序空间 在某种可比较大小的期刊范围内(同一学科内)将TC 、IF 分别归一化处理为tc 、if ,并按其大小进行期刊排序,即可在排序意义上将TC 、IF 映射到一个2维空间,称为“期刊影响力排序空间”。 定义2:期刊影响力等位线 在“期刊影响力排序空间”内,定义影响力最大的期刊为(1,1),各刊与之的距离为 22B -1)A 1(R ) (+-=,期刊影响力相等的点连成的线即为期刊影响力等位线。显然,等位线就是以(1,1)为圆心的圆弧,见图1。 定义3:期刊影响力指数(CI ) 学术期刊影响力指数(Academic Journal Clout Index ,简称CI ),是反映一组期刊中各刊影响力大小的综合指标,它是将期刊在统计年的总被引频次(TC )和影响因子(IF )双指标进行组内线性归一后向量平权计算所得的数值,用于对组内期刊排序。 CI 的计算公式为: [][]1,0B T C T C T C T C B 1,0A IF IF IF IF A 1)B 1()A 1(2CI 2 2∈--= ∈--=-+--=组内最小 组内最大组内最小个刊组内最小组内最大组内最小 个刊其中)( CI 的几何意义如下:
Nature Communications 10.742,综合:一区,12.124 Nucleic Acid Research 8.808,生物:一区;10.162 Scientific Reports 5.078,综合类:二区,4.259 Methods 3.221,生物,二区,3.802 BMC Systems Biology 2.853,生物:3区,2.003 Journal of Biomedical informatics 2.482,医学:3区;2.753 Journal of Computational Biology 1.670,生物:四区;1.032 Journal of Bioinformatics and Computational Biology 0.931,生物:四区;0.800 Journal of Theoretical Biology1.833 生物、数学与计算生物学三区 Journal of Mathematical Biology 1.786 生物4区数学与计算生物学3区Bioinformatics (IF: 4.328) BMC Bioinformatics (IF: 3.781),生物:三区;2.448 BMC Biology (IF: 4.734),生物:一区;6.779 Briefings in Bioinformatics (IF: 4.627),生物:一区;5.134 Journal of Computational Biology (IF: 1.563),生物:四区;1.032 PLoS Computational Biology (IF: 5.895),生物:二区,2.542 Mathematical Biosciences (IF: 1.148),生物:四区;1.246 Journal of Biomedical Informatics (IF: 1.924),医学:三区;2.753 Molecular Biosystems ( IF: 4.236),生物:三区;2.781 Frontiers in Genetics 4.151 生物二区 Microbial Ecology 3.614 生物:二区,微生物3区
排名代码期刊名称总被引频次影响因子 1 G190 世界华人消化杂志5249 2.924 2 G275 WORLD J OF GASTROENTEROLOG 1908 2.633 3 G147 中华结核和呼吸杂志2333 1.54 4 G654 护理研究1074 1.506 5 G170 中华心血管病杂志2022 1.444 6 G231 中华肝脏病杂志1131 1.44 7 G136 中华传染病杂志893 1.435 8 G152 中华流行病学杂志1400 1.293 9 G174 中华检验医学杂志1121 1.278 10 G138 中华儿科杂志2396 1.252 11 G272 中国实用外科杂志2499 1.229
12 G143 中华骨科杂志2821 1.184 13 G168 中华消化杂志1448 1.174 14 G194 中华医院感染学杂志1849 1.169 15 G591 中华医院管理杂志1420 1.152 16 G146 中华护理杂志2441 1.125 17 G900 中华烧伤杂志431 1.105 18 G156 中华内科杂志2193 1.092 19 G197 中华神经科杂志1616 1.044 20 G316 解放军护理杂志827 1.023 21 G161 中华肾脏病杂志845 1.022 22 G160 中华神经外科杂志1387 1.017 23 G116 中国危重病急救医学1378 1.017
24 G137 中华创伤杂志1252 1.011 25 G249 骨与关节损伤杂志734 1.004 26 G305 中国实用护理杂志1533 0.967 27 G299 中国临床康复3306 0.931 28 G140 中华放射学杂志2494 0.926 29 G142 中华妇产科杂志1982 0.902 30 G159 中华精神科杂志421 0.881 31 G192 中国脊柱脊髓杂志712 0.863 32 G155 中华内分泌代谢杂志890 0.858 33 G179 中华肿瘤杂志1427 0.84 34 G176 中华医学杂志2719 0.827 35 G985 中国艾滋病性病393 0.798
一、为了说明问题更有条理,我先对SCI/EI收录的会议论文进行说明: (1)EI收录主要收录在期刊上发表的国际会议和国际会议论文集。其中会议论文集、专著等。其中IEE/IEEE、SPIE、ASME、ASCE 等学会的国际会议论文集几乎全部收录。 (2)SCI、SSCI主要收录在期刊上发表的国际会议,如国际会议专刊、增刊,并收录在期刊上刊登的国际会议摘要。SCI、SSCI不收录国际会议论文集(图书)。 (3)ISTP、ISSHP主要收录在专著、期刊、报告、增刊及预印本等形式出版的各种一般会议、座谈、研究会和专题讨论会的会议录文献,包括CD-ROM,EI收录的会议ISTP不一定收录。 (4)部分会议会ISTP、ISSHP被同时收录。 二、对近来部分会议声称能被会议出版的说明: 近来有大量的会议声明能够被一些期刊,如AMR《Advanced Materials Research》,等期刊正刊出版,并且能够被EI检索,对此,大家要注意了,这里鱼目混杂,要擦亮眼睛注意: (1)AMR《Advanced Materials Research》,等这些刊物确实能够被EI检索,因为这几个刊物都是专门接受会议投稿的,也就是专门收录会议论文的,不接受作者的单独投稿。只要能被这个刊物收录可以说就一定能被EI检索,除非你的论文有重大的格式错误,但注意检索类型是CA类型(也就是会议论文)。
(2)论文能否进入这几个刊物,关键就是看你参加的会议是否能够属于刊物的会议列表里,最简单的方法是进入https://www.doczj.com/doc/3412319769.html,/网站,输入你要查询的会议名称,如果该会议能够在此网站上查的到,才证明你的论文能够被该刊物收录,也就说明你的论文能够被Ei检索。 (3)这几个刊物都是属于瑞士TTP出版公司旗下的刊物,其旗下的刊物还有如下刊物,这些刊物上发表的文章都能被EI检索:MSF>Materials Science Forum KEM>Key Engineering Materials SSP>Solid State Phenomena DDF>Defect and Diffusion Forum AMM>Applied Mechanics and Materials AMR>Advanced Materials Research AST>Advances in Science and Technology JNanoR>Journal of Nano Research JBBTE>Journal of Biomimetics, Biomaterials, and Tissue Engineering JMNM>Journal of Metastable and Nanocrystalline Materials JERA>International Journal of Engineering Research in Africa (4)Key Engineering Materials 《关键工程材料》瑞士
SCI各领域国际顶尖学术期刊一览 中国科学院科技情报中心将各领域的SCI期刊按影响因子大小分成四个区,其中一区和二区为高影响因子论文,三区为中等影响因子论文,四区为低影响因子论文。其中,一区和二区的一小部分杂志被列为顶尖学术期刊(TopJournal)。 要比较各校在高水平的杂志的论文发表情况,可以根据顶尖杂志的名单和一区二区的杂志名单,查询ISI网站,谁好谁差,一比就知,无需争辩,一目了然。 以下为各领域顶尖学术期刊的详细名单 分区中文分类刊名简称 1 地学ACTAASTRONOM 1 地学ADVGEOPHYS 1 地学AMJSCI 1 地学BAMMETEOROLSOC
1 地学CLIMDYNAM 1 地学JCLIMATE 1 地学JPETROL 1 地学LIMNOLOCEANOGR 1 地学QUATERNARYSCIREV 1 地学REVGEOPHYS 1 地学TELLUSB 2 地学AMMINERAL 2 地学CHEMGEOL 2 地学EARTHPLANETSCLETT 2 地学GEOCHIMCOSMOCHIMAC 2 地学GEOLOGY 2 地学GEOPHYSRESLETT 2 地学JGEOPHYSRES 2 地学JATMOSSCI
2 地学MONWEATHERREV 1 地学天文ANNUREVASTRONASTR 1 地学天文ASTROPHYSJ 1 工程技术ACTAMATER 1 工程技术ADVMATER 1 工程技术AICHEJ 1 工程技术ANNUREVBIOMEDENG 1 工程技术ANNREVMATERRES 1 工程技术APPLSPECTROSC 1 工程技术ARTIFINTELL 1 工程技术ARTIFLIFE 1 工程技术BIOMATERIALS 1 工程技术CHEMVAPORDEPOS 1 工程技术CHEMMATER
【环境科学】较高水平学术期刊名称及影响因子排序(IF) Field IF(2010) Journal Title ECOLOGY LETTERS环境科学15.253 FRONTIERS IN ECOLOGY AND THE ENVIRONMENT环境科学8.820 GLOBAL CHANGE BIOLOGY环境科学 6.346 ISME Journal环境科学 6.153 ENVIRONMENTAL HEALTH PERSPECTIVES环境科学 6.087 ECOLOGICAL MONOGRAPHS环境科学 5.938 EVOLUTION环境科学 5.659 ENVIRONMENTAL MICROBIOLOGY环境科学 5.537 GLOBAL ECOLOGY AND BIOGEOGRAPHY环境科学 5.273 ECOLOGY环境科学 5.073 CONSERVATION BIOLOGY环境科学 4.894 APPLIED CATALYSIS B-ENVIRONMENTAL环境科学 4.749 CRITICAL REVIEWS IN ENVIRONMENTAL SCIENCE AND TECHNOLOGY环境科学 4.000 BULLETIN OF THE AMERICAN MUSEUM OF NATURAL HISTORY环境科学 3.057 GLOBAL BIOGEOCHEMICAL CYCLES环境科学 5.263 JOURNAL OF ECOLOGY环境科学 5.260 JOURNAL OF APPLIED ECOLOGY环境科学 4.970 GLOBAL ENVIRONMENTAL CHANGE-HUMAN AND POLICY DIMENSIONS环境科学 4.918 JOURNAL OF ENVIRONMENTAL SCIENCE AND HEALTH PART 环境科学 4.840 C-ENVIRONMENTAL CARCINOGEN ENVIRONMENTAL SCIENCE & TECHNOLOGY环境科学 4.827 AMERICAN NATURALIST环境科学 4.736 Conservation Letters环境科学 4.694 ENVIRONMENT INTERNATIONAL环境科学 4.691 FUNCTIONAL ECOLOGY环境科学 4.645 WATER RESEARCH环境科学 4.546 PERSPECTIVES IN PLANT ECOLOGY EVOLUTION AND SYSTEMATICS环境科学 4.488 JOURNAL OF ANIMAL ECOLOGY环境科学 4.457 ECOGRAPHY环境科学 4.417 ECOLOGICAL APPLICATIONS环境科学 4.276 JOURNAL OF BIOGEOGRAPHY环境科学 4.273 31DIVERSITY AND DISTRIBUTIONS环境科学 4.248 International Journal of Greenhouse Gas Control环境科学 4.081 JOURNAL OF TOXICOLOGY AND ENVIRONMENTAL HEALTH-PART 环境科学 4.041 B-CRITICAL REVIEWS REMOTE SENSING OF ENVIRONMENT环境科学 3.954 ANNUAL REVIEW OF ENVIRONMENT AND RESOURCES环境科学 3.737 ECOSYSTEMS环境科学 3.679 Biogeosciences环境科学 3.587
中国大陆中文期刊影响因子总排名排名代码期刊名称影响因子总被引频次 1R039电网技术2.857 5080FALSEFALSETRUE 2E309岩石学报2.649 2279FALSEFALSETRUE 3A113实验技术与管理2.587 1393FALSEFALSETRUE 4R040中国电机工程学报2.537 8127FALSEFALSETRUE 5E124中国沙漠2.455 2504FALSEFALSETRUE 6X031中国公路学报2.444 1239FALSEFALSETRUE 7H046PEDOSPHERE2.331 734FALSEFALSETRUE 8E010地质学报2.326 1651FALSEFALSETRUE 9E305地理学报2.302 3164FALSEFALSETRUE 10E139地质科学2.212 2187FALSEFALSETRUE 11A108中国科学D2.062 2760FALSEFALSETRUE 12A115实验室研究与探索2.026 1366FALSEFALSETRUE 13E146大地构造与成矿学1.906 548FALSEFALSETRUE 14G146中华护理杂志1.861 5805FALSEFALSETRUE 15H012土壤学报1.840 2670FALSEFALSETRUE 16E005高原气象1.715 1749FALSEFALSETRUE 17M102新型炭材料1.714 705FALSEFALSETRUE 18Z012自然资源学报1.675 1926FALSEFALSETRUE 19G138中华儿科杂志1.652 3413FALSEFALSETRUE 20F049生物多样性1.639 1077FALSEFALSETRUE 21E153地球物理学报1.634 2518FALSEFALSETRUE 22E008海洋与湖沼1.631 1574FALSEFALSETRUE 23F009植物生态学报1.590 2636FALSEFALSETRUE 24E654中国地质1.576 658FALSEFALSETRUE 25E001气象学报1.559 1935FALSEFALSETRUE 26E310地理研究1.556 1499FALSEFALSETRUE 27L031石油勘探与开发1.512 2205FALSEFALSETRUE 28E009地质论评1.495 1512FALSEFALSETRUE 29X672交通运输工程学报1.491 618TRUETRUETRUE
各学科SCI影响因子介绍:只做参考TOP JOURNAL 1、SCI 期刊分层方案。 2、超一流期刊影响因子 NA TURE 30.979 SCIENCE 29.162 3、一级学科顶级期刊综合版目录 a. NATURE 子系列(约26 种) 期刊名称影响因子(IF) NAT REV MOL CELL BIO 35.041 NAT REV CANCER 33.954 NAT MED 30.550 NAT IMMUNOL 28.180 NAT REV NEUROSCI 27.007 NAT REV IMMUNOL 26.957 NAT GENET 26.494 NAT REV GENET 25.664 NAT CELL BIOL 20.268 NAT REV DRUG DISCOV 17.732 NAT BIOTECHNOL 17.721 NAT NEUROSCI 15.141 NAT STRUCT BIOL 11.579 NAT MA TER 10.778 NAT REV MICROBIOL NAT METHODS NAT CHEM BIO NAT PHYSICS NCP CARDIOV ASCULAR MEDICINE NCP GASTROENTEROLOGY & HEPATOLOGY NCP ONCOLOGY NCP UROLOGY NCP ENDOCRINOLOGY & METABOLISM NCP NEPHROLOGY NCP NEUROLOGY NCP RHEMATOLOGY 3 b. 影响因子大于20 的期刊(根据03 年影响因子,去除SCIENCE、NATURE、NATURE 系列,则为13 种) 期刊名称影响因子(IF) ANNU REV IMMUNOL 52.28 ANNU REV BIOCHEM 37.65 PHYSIOL REV 36.83 NEW ENGL J MED 34.83 CA-CANCER J CLIN 33.06
《中国学术期刊影响因子年报》部分指标说明 1. 可被引文献比:某期刊在指定时间范围内发表的可被引文献量与载文量之比。 2. 总被引频次:某期刊自创刊以来发表的全部文献在统计年被指定统计源期刊引用的总次数。 3.即年指标:又称当年指数,指某期刊在统计年发表的可被引文献在当年被某类统计源期刊引用的总次数与该期刊当年发表的可被引文献总量之比。 4. 他引影响因子:某期刊前两年发表的可被引文献被某类统计源期刊中本刊之外的期刊引用的总次数与该刊在此两年内发表的可被引文献总量之比。 5.基金论文比:某期刊在指定时间范围内发表的各类基金资助的论文占可被引文献的比例。 6. 被引半衰期:将某期刊在统计年被某类统计源期刊引用的全部文献从统计年起依出版时间顺序排列,依时间顺序累加被引次数。累加被引次数达到该期刊总被引频次的1/2时,统计年至该时间的年数即为该期刊的被引半衰期。 7. 互引指数:将某刊前2年发表的可被引文献在统计年的被引频次,按施引期刊分组,依各期刊的引用频次由大到小排序,取累计被引频次恰好大于等于总被引频次的50%时的期刊种数,定义该种数值为该刊的“互引期刊数”。再将该学科各个期刊的“互引期刊数”求平均值,以该平均值为互引指数的分母。互引指数的分子为该刊的“互引期刊数”。 互引指数用于判断某期刊是否与其他期刊之间存在互引同盟倾向(为了提高影响因子而约定相互引用的倾向)。互引指数越小,表示该刊的被引用集中度较明显;反之,表示该刊的被引用集中度不明显。 8.Web即年下载率:某期刊在统计年由“中国知网”网络出版的文献在当年被全文下载的总篇次与该期刊当年出版当年上网的文献总数之比。 9.Web下载量:某期刊由“中国知网”网络出版的文献在统计年被全文下载的总篇次。