Finite Element Analysis of Structural Steelwork Beam to Column Bolted Connections
Jim Butterworth
Constructional Research Unit,
School of Science & Technology,
University of Teesside, UK.
Abstract
A combination of simple fabrication techniques and speedy site erection have made bolted endplates one of the most popular methods of connecting members in structural steelwork frames. Although simple in their use bolted endplates are extremely complex in their analysis and behaviour. In 1995 the Steel Construction Institute (SCI) and the British Constructional Steelwork Association (BCSA) jointly published a design guide for moment resisting connections [1]. The Green Book design method offers increased connection capacity using a combination of theoretical overstress in the beam compression zone and plastic bolt force distribution. This paper reports on a PhD research program at the University of Teesside which uses a combination of full scale testing and materially non-linear three dimensional finite element analyses (FEA) in order to investigate extended end plate beam-to-column connections. The FEA analyses, incorporating MYSTRO and LUSAS software [2], use enhanced strain solid and contact gap elements to model the connection behaviour. Introduction
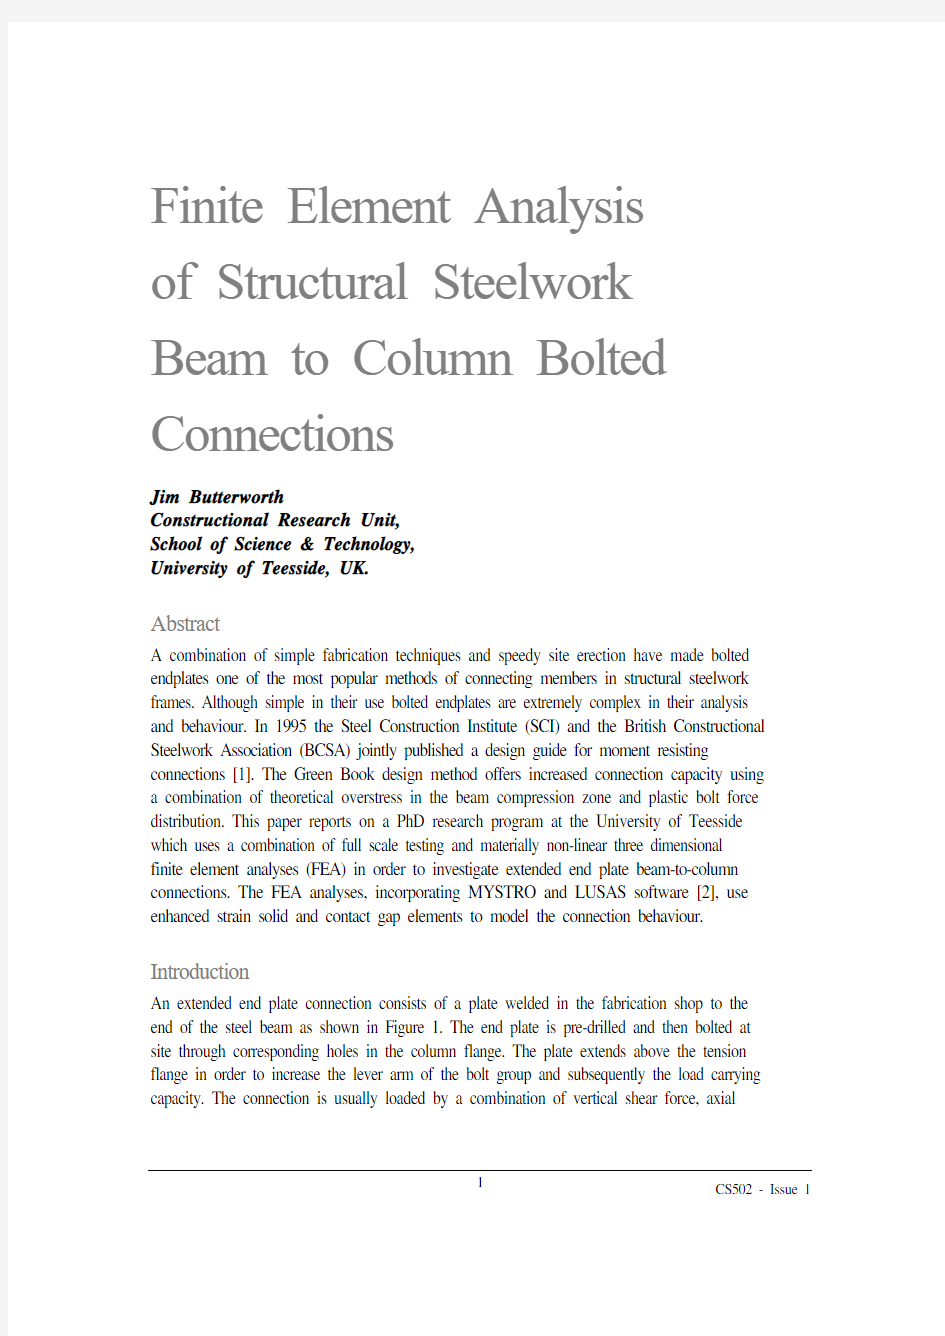
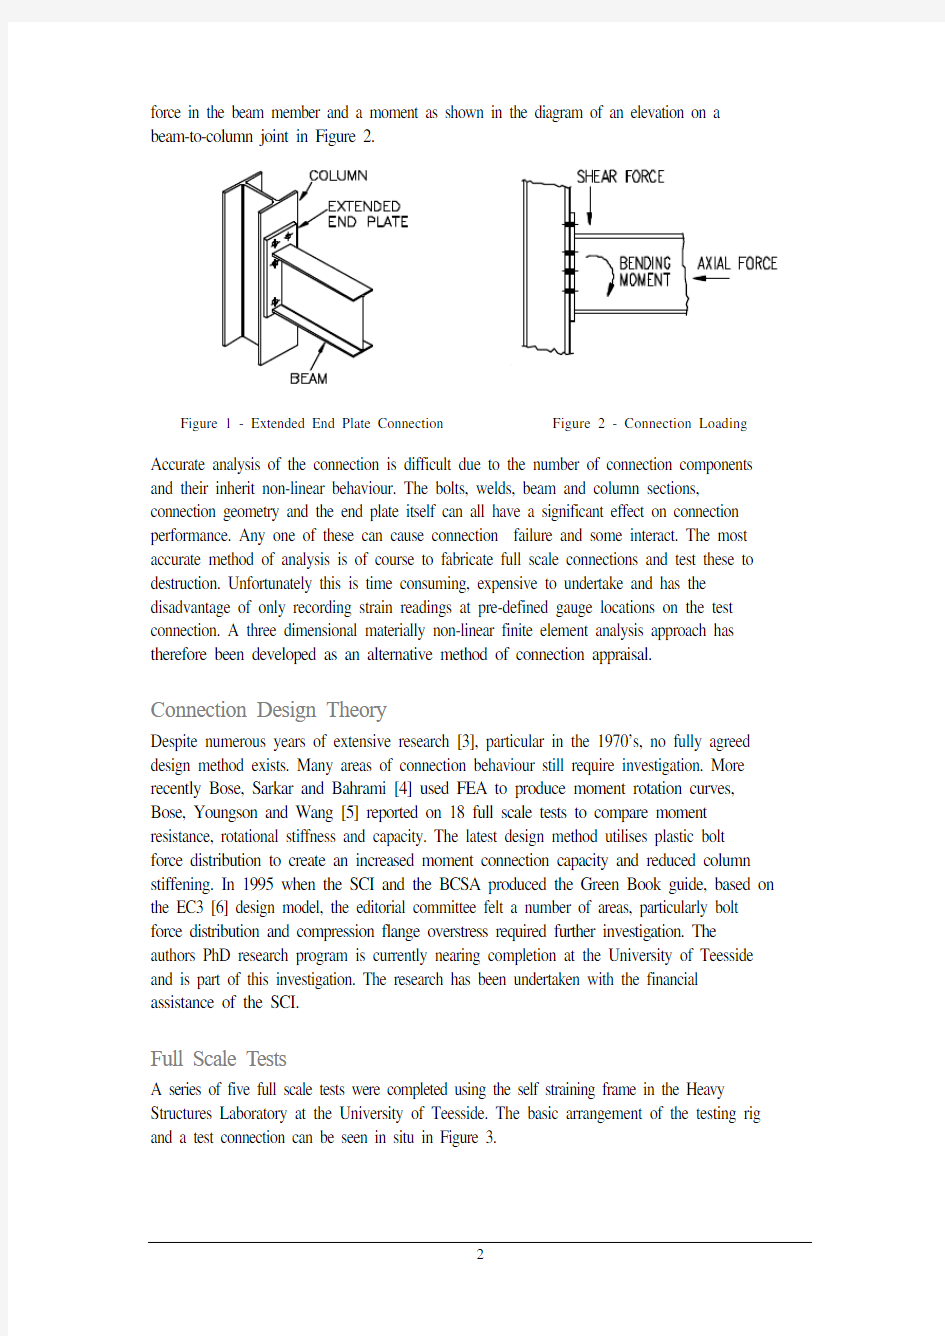
An extended end plate connection consists of a plate welded in the fabrication shop to the end of the steel beam as shown in Figure 1. The end plate is pre-drilled and then bolted at site through corresponding holes in the column flange. The plate extends above the tension flange in order to increase the lever arm of the bolt group and subsequently the load carrying capacity. The connection is usually loaded by a combination of vertical shear force, axial
force in the beam member and a moment as shown in the diagram of an elevation on a beam-to-column joint in Figure 2.
Figure 1 - Extended End Plate Connection Figure 2 - Connection Loading Accurate analysis of the connection is difficult due to the number of connection components and their inherit non-linear behaviour. The bolts, welds, beam and column sections, connection geometry and the end plate itself can all have a significant effect on connection performance. Any one of these can cause connection failure and some interact. The most accurate method of analysis is of course to fabricate full scale connections and test these to destruction. Unfortunately this is time consuming, expensive to undertake and has the disadvantage of only recording strain readings at pre-defined gauge locations on the test connection. A three dimensional materially non-linear finite element analysis approach has therefore been developed as an alternative method of connection appraisal.
Connection Design Theory
Despite numerous years of extensive research [3], particular in the 1970’s, no fully agreed design method exists. Many areas of connection behaviour still require investigation. More recently Bose, Sarkar and Bahrami [4] used FEA to produce moment rotation curves, Bose, Youngson and Wang [5] reported on 18 full scale tests to compare moment resistance, rotational stiffness and capacity. The latest design method utilises plastic bolt force distribution to create an increased moment connection capacity and reduced column stiffening. In 1995 when the SCI and the BCSA produced the Green Book guide, based on the EC3 [6] design model, the editorial committee felt a number of areas, particularly bolt force distribution and compression flange overstress required further investigation. The authors PhD research program is currently nearing completion at the University of Teesside and is part of this investigation. The research has been undertaken with the financial assistance of the SCI.
Full Scale Tests
A series of five full scale tests were completed using the self straining frame in the Heavy Structures Laboratory at the University of Teesside. The basic arrangement of the testing rig and a test connection can be seen in situ in Figure 3.
Figure 3 - Elevation on the Testing Frame
The beam to column joint was bolted into the frame and tested in an inverted position. Loading on the connection was provided with a 20 tonne jack situated on the top of the straining frame and activated by hand from a pull ram positioned on the laboratory floor. The jack was connected to the beam with a 25mm dia. high tensile steel bar and shackle arrangement. The shackle arrangement allowed adequate rotation to be obtained to ensure a truly vertical pull was always applied. To measure the force a load cell is placed between the jack and a steel block positioned on the top of the straining frame. The load cell is then connected to the statimeter. All connections used M20 grade 8.8 bolts which were torqued up to 110 Nm. 110 Nm is considered to represent a typical tightening force obtained using a steelwork erectors podger spanner. Test E1 used a lever arm of 1000mm, unfortunately this was found to be too small to produce failure with the loading equipment available. Therefore in subsequent tests the lever arm was increased to 1900mm. Connection details and dimensions were taken from ref. [1] with the exception of Test E2 which used an end plate thickness of 15mm. The Green Book recommended an end plate thickness of 20mm.
All tests used the same arrangement for the location of the strain and dial gauges. Three strain gauges were applied to both beam compression and tension flanges. Six gauges were applied to the beam web, local to the tension and compression areas. Dial gauges were situated under the tension flange to measure rotation. The bolt strains were measured by bonding Kyowa type KFG-3-120-C20-11 gauges into the bolts. The 11 mm long circular strain gauges were inserted into a 2 mm dia. hole drilled into the centre of each bolt head. The bolts were previously all individually calibrated in a specially fabricated bolt testing assembly to obtain a bolt force to strain calibration factor. Strain readings were taken by connection of the gauges to two Vishay portable strain indicators and readings at each load increment noted.
The arrangement of test strain/dial gauges are shown in Figure 4. Details of a bolt strain gauge are shown in Figure 5.
Details of the five section sizes tested are given in the following table:
Test Ref Beam Size
(GR355)
Column Size
(GR355)
Column
Stiffene
d
End Plate
WxThkxL
No. of M20
Gr 8.8
Bolts
Beam Welds
Top-Web-
Btm
E1356 x 127 x 33UB254UC73Yes200 x 20 x 460612-6-6 E2356 x 127 x 33UB254UC73Yes200 x 15 x 46088-6-6 E3356 x 171 x 51UB254UC73Yes200 x 20 x 4601010-6-6 E4254 x 146 x 37UB203UC60No200 x 20 x 37068-6-6 E5457 x 191 x 67UB203UC60No200 x 20 x 570810-6-6
Table 1 - Full Scale Test Details
Full Scale Test Results
Test E1 had to be unfortunately halted at 215 kNm due to the capacity of the jack. Test E2 failed at 220 kNm when the compression flange buckled. Test E2 at its ultimate load of 220 kNm had a flange stress of 607 N/mm2 when the compression flange buckled. At this time the flange was overstressed by 70%. The Green Book design allows a compression flange to be overstressed by 40% with 20% of this apportioned to material strain hardening and the remaining 20% to dispersal into the beam web. Test E3 failed at a connection moment of 290 kNm due to thread stripping of both the bolts and nuts local to the tension area. At the time of failure considerable bending of the end plate local to the tension flange was clearly visible. Tests E4 and E5 both failed as expected due to column flange bending. Table 2 shows details of the test results compared with the Green Book theoretical capacities and from these the relevant safety factors.
Test Ref
Green
Book
Capacity
Test
Failure
Load
Safety Factor /
Green Book
Mode of Test Failure
E1160 kN215 kN 1.34Test halted at 215 kNm due to jack
capacity E2159 kN220 kN 1.38Beam compression flange buckled E3222 kN290 kN 1.31Upper rows bolt failure (thread stripping) E4101 kN135 kN 1.34Column flange bending
E5147 kN253 kN 1.72Column flange bending
Table 2 - Full Scale Test Results
Finite Element Model
MYSTRO and LUSAS FEA software was used for the finite element analysis. The FEA models were created using command files rather than the CAD interface tools even though this method was longer and initially tedious. The command file could simply be copied and edited. The command file also was more logical in order than command files produced by the software after a model has been created. The command file was also well described by
comments within the file to provide a complete history of the model creation. FEA models can often be a black box that provides answers without the user being fully aware of what the model exactly entails. The extra work in creating the command files has been well worth the effort and allowed the subsequent models to be created quickly.
The technique of FEA lies in the development of a suitable mesh arrangement. The mesh discretisation must balance the need for a fine mesh to give an accurate stress distribution and reasonable analysis time. The optimal solution is to use a fine mesh in areas of high stress and a coarser mesh in the remaining areas. To further reduce the size of the model file and the subsequent processing time symmetry was employed. The connection arrangement was symmetrical about a vertical centre line and therefore viewed from 1,1,1 only the right
Figure 6 - FEA Elements
Element Types
At the beginning of the research a number of trial models were created. Models with fewer elements as well as models with only shell elements were tried and also a number of different methods of modelling the bolts were created before the final arrangement of mesh and elements used was decided upon. The final FEA models use the five element types as shown in Figure 6. HX8M elements are three dimensional solid hexahedral elements comprising 8 nodes each with 3 degrees of freedom. Although the HX8M elements are linear with respect to geometry, they employ an assumed internal strain field which gives them the ability to perform as well as 20 noded quadratic iso-parametric elements. These elements are used to model the beam flanges, end plate and connecting column flange. QTS4 and TTS3 elements are three dimensional flat facet thick shell elements comprising either 3 or 4 nodes each with 5 degrees of freedom and are used to model the beam and column webs, beam closing plate, column back flange and stiffeners. JNT4 elements are non-linear contact gap joint elements and are used to model the interface between the end plate and the column flange. The bolts were modelled using BRS2 elements for the bolt shank and HX8M elements for the head and nut as shown in Figure 10. BRS2 are three dimensional bar elements comprising 2 nodes each with 3 degrees of freedom. Each BRS2 element was equivalenced with the appropriate HX8M bolt head and nut to comprise the complete bolt assembly. All bolts used are M20 grade 8.8 and were assigned an area of 245mm2 which is equal to the tensile stress area [7]. The bolts in the full scale test were torqued to produce an consistent starting bolt force. This was included in the model as an initial prestress in the BRS2 elements. The bolt holes were modelled as square cut-outs in the end plate and column flange. Figure 7 shows a FEA model with the final arrangement of mesh discretisation. Figure 8 shows the FEA supports and loading.
Figure 9 - Extended End Plate and Bolts Figure 10 - Enlarged FEA Bolt Arrangement In order to further reduce the models size and analysis time, tied slidelines were used to model the interface between the two sections of beam flange. The 1000mm long flange is split into two sections 300mm and 700mm long. The 300mm sections of the beam flanges adjacent to the end plate have two elements through the flange thickness to allow for greater
accuracy of analysis results. Similarly two elements are also used throughout the whole of the end plate thickness.
Non-Linear Analysis
Material non-linearity occurs when the stress-strain relationship ceases to be linear and the steel yields and becomes plastic. The three sets of material data were as follows: For the elastic dataset all elements were defined as elastic isotropic with a Young’s Modulus of Elasticity of 2.05 x 10⁵ N/mm2 and Poisson’s lateral to longitudinal strain ratio of 0.3. The actual materials test certificates were obtained for all steel and enabled stress/strain curves to be based on actual values rather than theoretical. Tensile tests were completed on a selection of bolts to enable material properties to be as accurate as possible. Von Mises yield criteria was used for all material.
Boundary Conditions
Displacements in the X,Y and Z directions were restrained at the top and bottom of the half column. Displacements in the X direction were restrained along all surfaces on the centre line of the model. The FEA model had problems converging when the beam end plate had no supports restraining movement in the Y direction due to the lack of bending resistance in the bolt BRS2 elements. Therefore supports had to be added to the underside of the end plate. This removed the shear force from the bolts but not of course from the remaining connection elements. Shear in moment connections is usually of minor importance but it is felt that the supports are a compromise. The column to end plate interface was modelled using JNT4 joint elements with a contact spring stiffness K of 1E9 N/mm2. Loading was via a 10 kN point load on the cantilever end. The load was then factored in the control file to achieve the required range of connection bending moments.
FEA and Test Results
The Green Book capacity for Test E1 was limited to 160 kNm due to the capacity of the bolts. At this loading the compression flange was expected to have stresses in the order of 370 N/mm2. This agreed with the FEA model which also indicated considerable stresses, up to 500 N/mm2, in the bottom corner of the beam web. As the load on Test E1 increased the stresses in the compression flange reached up to 500 N/mm2. The area of beam web which had stresses above 400 N/mm2 increased to approximately a quarter of the beam depth. Test E2’s theoretical capacity was limited by its compression flange and at its failure load of 220 kNm had a compression flange stress of 607 N/mm2. At this point the flange was theoretically overstressed by 71% and finally caused buckling and ultimately failure. Figure 11 indicates the Von Mises stress contours at a load close to the test failure bending moment.
Figure 11 - Von Mises Stress Contours E2
As in Test E1, Test E3’s Green Book capacity was limited by the bolt strength and this was confirmed when at a moment of 290 kNm the bolts failed. At this load the compression flange indicated stresses up to 500 N/mm2 with again beam web stresses up to a quarter of the beam depth reaching 500 N/mm2. Approximately half of the beam web at the end plate interface had stresses over 400 N/mm2. In all cases it was found that the higher the connection force the greater the distribution of stresses into the beam web. Test E4 & E5 Green Book capacities were both governed by shear on the column web panel. For Test E4 at 135 kNm the column section failed due to column flange bending rather than web failure. Similarly Test E5 failed by flange deformation but at a considerably higher connection moment than the theoretical capacity.
Connection Bolt Forces
Strain gauged bolts from the tests are compared in Table 3 with the forces obtained from the FEA and the Green Book theory. FEA and test results for the bolt forces indicated good correlation. In comparison with the Green Book theory it was found that in nearly all cases
the forces obtained from the top rows of bolts were higher in the FEA and test results than in the predicted theory. It was also found that the Green Book design guide assumed larger forces in the lower bolt rows than in both the FEA and test models. The plastic bolt force distribution theory assumes some deformation of the end plate or column flange takes place in order that the connection forces can be distributed down the connection into the lower bolts. This was found not to happen to the extent expected in the theory. From tensile tests on the connection bolts it was found that the bolts had considerable reserve capacity. In all the tests the steel rolling mill certificates were also obtained and it was found that all cases the steels yield strength was considerably larger than required by the British Standard. In some cases almost a grade higher. It is considered that the increased strength in the material prevented the connection force transmitting itself down the connection into the lower rows. This would explain the larger forces in the higher rows and the reduced forces in the lower rows. In spite of these observations the Green Book theory was found to have approximately a 30% safety margin over the test failure load.
Green Book Bolt forces kN
FEA
Bolt forces kN
Full Scale Test
Bolt forces
Test E1Top row
2nd row
Btm row 230
252
246
258
8
260
260
12
Test E2Top row
2nd row
3rd row
Btm row
184
239
107(186)
252
258
120
4
266
254
82
16
Test E3Top row
2nd row
3rd row
4th row
Btm row 233
252
217
129
308
308
185
60
8
310
312
130
24
12
Test E4Top row
2nd row
Btm row
222
193(231)
244
220
30
240
230
34
Test E5Top row
2nd row
3rd row
Btm row
226
189(227)
0(221)
177
166
92
14
176
164
90
26
Figures in brackets () indicate the potential bolt forces if the connection was not limited by some other failure criteria e.g. beam compression flange, column web panel, etc.
Table 3 - Bolt Forces
Figures 12 and 13 indicates a comparison between test and FEA bolt forces for models E1 and E5.
Rotations
Initially the FEA models had the top and bottom of the columns restrained fully in all directions. In comparison with the full scale tests it was found that the rotations on the test connections were considerable larger than on the FEA models. Although connection rotations are not considered an important aspect of this particular research program it was felt that the models should reflect the tests as close as possible. Upon investigation it was found that the steel column in the full scale test had only a 10mm thick end plate welded onto the column ends for fixing the column to the frame. During the test it was found that the end plate started to bend and lift at the centre causing the greater rotations. The FEA models were therefore modified with springs added to the top and bottom of the columns. Figure 14 shows a comparison of the FEA and test rotations for E3 after correlation.
Conclusions
In both the FEA and the laboratory tests it was consistently found that the Green Book design theory underestimated the bolt forces in the top rows of the connection and
overestimated the forces in the lower rows. Overall plastic bolt distribution was not seen to happen in the manner assumed by the new theory. Tested bolts had a substantial reserve of
capacity. The lowest bolt failure load found in tensile tests was 206 kN. The Green Book theory allows 137 kN in tension.
In Test E3 connection failure was caused by thread stripping of both the bolt and the nut. This could be resolved if bolts used were specified to European Standards rather than BS 3692.
The new rule of thumb allowing the compression flange to be theoretically overstressed by 40% did not appear to be unreasonable. The 40% rule is derived from a 20% dispersal of stress into the beam web and the remaining 20% apportioned to material strain hardening. It was found the higher the loading on the connection the greater the distribution of stress into the beam web.
It was also discovered that the steel beams and columns rolled in the mill have a substantially greater yield stress than required, in some cases almost a grade higher. Whilst in elastic design this reserve of capacity is of benefit to the Engineer. In plastic design when members and connections are designed to yield this reserve of capacity has the effect of not allowing the connection to behave in the manner assumed. In connections using plastic bolt force distribution the end plate and/or column flange are assumed to deform in order that the force in the bolts can be dispersed down the connection into the lower rows.
In spite of this the new Green Book theory with the increased connection capacities still had a reserve of approximately 30%.
Overall the finite element analysis of extended end plate connections can be seen to provide advantages in terms of time and expense over full scale testing and can produce a more complete picture of stress, strain and force distributions.
Acknowledgements
The steelwork used in the tests was kindly donated and fabricated by Cleveland Bridge & Engineering in Darlington and Kvaerner Oil and Gas in Middlesbrough. Use of the MYSTRO and LUSAS software and technical support is also acknowledged as is the financial and technical assistance of the Steel Construction Institute.
References
1. Joints in Steel Construction - Moment Connections, BCSA/SCI Pub. No. 207/95.
2. MYSTRO/LUSAS is produced by FEA Ltd, Kingston-upon-Thames, KT1 1HN.
3. Nethercott D.A., Steel beam to column connections - A review of test data,
Construction Industry Research & Information Association, 1985.
4. Bose B, Sarkar S, and Bahrami M, Finite Element Analysis of unstiffened extended end
plate connections, Structural Engineering Review, 3, 211-224, 1991.
5. Bose B, Youngson G K, and Wang Z M, An appraisal of the design rules in Eurocode 3
for bolted end plate joints by comparison with experimental results, Proceedings from the Institute of Civil Engineers Structures and Buildings, 1996.
6. DD ENV 1993 - 1.1:1992 Eurocode 3: Design of steel structures Part 1.1 General rules
for buildings.
7. British Standards Institute, Specification for ISO metric precision hexagonal bolts,
screws and nuts BSI London, 1967, BS 3692.
Contact Information
Jim Butterworth,
Constructional Research Unit,
School of Science & Technology, University of Teesside
Email: jimbutterworth@https://www.doczj.com/doc/394138647.html, FEA Ltd
Forge House
66 High Street
Kingston upon Thames Surrey, KT1 1HN, UK. Tel: +44 (0)20 8541 1999 Fax: +44 (0)20 8549 9399 Email: info@https://www.doczj.com/doc/394138647.html, https://www.doczj.com/doc/394138647.html,
基于ABAQUS的有限元分析和应用 第一章绪论 1.有限元分析包括下列步骤: 2.为了将试验数据转换为输入文件,分析者必须清楚在程序中所应用的和由实验人员提供的材料数据的应力和应变的度量。 3.ABAQUS建模需注意以下内容: 4.对于许多包含过程仿真的大变形问题和破坏分析,选择合适的网格描述是非常重要的,需要认识网格畸变的影响,在选择网格时必须牢牢记住不同类型网格描述的优点。 第二章ABAQUS基础 1.一个分析模型至少要包含如下的信息:离散化的几何形体、单元截面属性、材料数据、载荷和边界条件、分析类型和输出要求。 ①离散化的几何形体:模型中所有的单元和节点的集合称为网格。 ②载荷和边界条件: 2.功能模块: (1)Assembly(装配):一个ABAQUS模型只能包含一个装配件。 (2)Interaction(相互作用):相互作用与分析步有关,这意味着用户必须规定相互作用是在哪些分析步中起作用。 (3)Load(载荷):载荷和边界条件与分析步有关,这意味着用户指定载荷和边界条件是在哪些分析步中起作用。 (4)Job(作业):多个模型和运算可以同时被提交并进行监控。 3.量纲系统 ABAQUS没有固定的量纲系统,所有的输入数据必须指定一致性的量纲系统,常用的一致性量纲系统如下:
4.建模要点 (1)创建部件:设定新部件的大致尺寸的原则必须是与最终模型的最大尺寸同一量级。(2)用户应当总是以一定的时间间隔保存模型数据(例如,在每次切换功能模块时)。(3)定义装配: 在模型视区左下角的三向坐标系标出了观察模型的方位。在视区中的第2个三向坐标系标出了坐标原点和整体坐标系的方向(X,Y和Z轴)。 (4)设置分析过程: (5)在模型上施加边界条件和荷载: 用户必须指定载荷和边界条件是在哪个或哪些分析步中起作用。 所有指定在初始步中的力学边界条件必须赋值为零,该条件是在ABAQUS/CAE中自动强加的。 在许多情况下,需要的约束方向并不一定与整体坐标方向对齐,此时用户可定义一个局部坐标系以施加边界条件。 在ABAQUS中,术语载荷通常代表从初始状态开始引起结构响应发生变化的各种因素,包括:集中力、压力、非零边界条件、体力、温度(与材料热膨胀同时定义)。
1 概述 螺栓是机载设备设计中常用的联接件之一。其具有结构简单,拆装方便,调整容易等优点,被广泛应用于航空、航天、汽车以及各种工程结构之中。在航空机载环境下,由于振动冲击的影响,设备往往产生较大的过载,对作为紧固件的螺栓带来强度高要求。螺栓是否满足强度要求,关系到机载设备的稳定性和安全性。 传统力学的解析方法对螺栓进行强度校核,主要是运用力的分解和平移原理,解力学平衡方程,借助理论和经验公式,理想化和公式化。没有考虑到连接部件整体性、力的传递途径、部件的局部细节(如应力集中、应力分布)等等。通过有限元法,整体建模,局部细化,可以弥补传统力学解析的缺陷。用有限元分析软件MSC.Patran/MSC.Nastran提供的特殊单元来模拟螺栓连接,过程更方便,计算更精确,结果更可靠。因此,有限元在螺栓强度校核中的应用越来越广泛。 2 有限元模型的建立 对于螺栓的模拟,有多种模拟方法,如多点约束单元法和梁元法等。 多点约束单元法(MPC)即采用特殊单元RBE2来模拟螺栓连接。在螺栓连接处,设置其中一节点为从节点(Dependent),另外一个节点为主节点(Independent)。主从节点之间位移约束关系使得从节点跟随主节点位移变化。比例因子选为1,使从节点和主节点位移变化协调一致,从而模拟实际工作状态下,螺栓对法兰的连接紧固作用。 梁元法模拟即采用两节点梁单元Beam,其能承受拉伸、剪切、扭转。通过参数设置,使梁元与螺栓几何属性一致。 本文分别用算例来说明这两种方法的可行性。 2.1 几何模型 如图1所示组合装配体,底部约束。两圆筒连接法兰通过8颗螺栓固定。端面受联合载荷作用。
一、有限单元法的基本原理 有限单元法(The Finite Element Method)简称有限元(FEM),它是利用电子计算机进行的一种数值分析方法。它在工程技术领域中的应用十分广泛,几乎所有的弹塑性结构静力学和动力学问题都可用它求得满意的数值结果。 有限元方法的基本思路是:化整为零,积零为整。即应用有限元法求解任意连续体时,应把连续的求解区域分割成有限个单元,并在每个单元上指定有限个结点,假设一个简单的函数(称插值函数)近似地表示其位移分布规律,再利用弹塑性理论中的变分原理或其他方法,建立单元结点的力和位移之间的力学特性关系,得到一组以结点位移为未知量的代数方程组,从而求解结点的位移分量. 进而利用插值函数确定单元集合体上的场函数。由位移求出应变, 由应变求出应力 二、ABAQUS有限元分析过程 有限元分析过程可以分为以下几个阶段 1.建模阶段: 建模阶段是根据结构实际形状和实际工况条件建立有限元分析的计算模型――有限元模型,从而为有限元数值计算提供必要的输入数据。有限元建模的中心任务是结构离散,即划分网格。但是还是要处理许多与之相关的工作:如结构形式处理、集合模型建立、单元特性定义、单元质量检查、编号顺序以及模型边界条件的定义等。
2.计算阶段:计算阶段的任务是完成有限元方法有关的数值计算。 由于这一步运算量非常大,所以这部分工作由有限元分析软件控制并在计算机上自动完成 3.后处理阶段: 它的任务是对计算输出的结果惊醒必要的处理, 并按一定方式显示或打印出来,以便对结构性能的好坏或设计的合理性进行评估,并作为相应的改进或优化,这是惊醒结构有限元分析的目的所在。 下列的功能模块在ABAQUS/CAE操作整个过程中常常见到,这个表简明地描述了建立模型过程中要调用的每个功能模块。 “Part(部件) 用户在Part模块里生成单个部件,可以直接在ABAQUS/CAE环境下用图形工具生成部件的几何形状,也可以从其它的图形软件输入部件。 Property(特性) 截面(Section)的定义包括了部件特性或部件区域类信息,如区域的相关材料定义和横截面形状信息。在Property模块中,用户生成截面和材料定义,并把它们赋于(Assign)部件。 Assembly(装配件) 所生成的部件存在于自己的坐标系里,独立于模型中的其它部件。用户可使用Assembly模块生成部件的副本(instance),并且在整体坐标里把各部件的副本相互定位,从而生成一个装配件。 一个ABAQUS模型只包含一个装配件。
螺栓组受力分析与计算 一.螺栓组联接的设计 设计步骤: 1.螺栓组结构设计 2.螺栓受力分析 3.确定螺栓直径 4.校核螺栓组联接接合面的工作能力 5.校核螺栓所需的预紧力是否合适 确定螺栓的公称直径后,螺栓的类型,长度,精度以及相应的螺母,垫圈等结构尺寸,可根据底板的厚度,螺栓在立柱上的固定方法及防松装置等全面考虑后定出。 1. 螺栓组联接的结构设计 螺栓组联接结构设计的主要目的,在于合理地确定联接接合面的几何形状和螺栓的布置形式,力求各螺栓和联接接合面间受力均匀,便于加工和装配。为此,设计时应综合考虑以下几方面的问题: 1)联接接合面的几何形状通常都设计成轴对称的简单几何形状,如圆形,环形,矩形,框形,三角形等。这样不但便于加工制造,而且便于对称布置螺栓,使螺栓组的对称中心和联接接合面的形心重合,从而保证接合面受力比较均匀。 2)螺栓的布置应使各螺栓的受力合理。对于铰制孔用螺栓联接,不要在平行于工作载荷的方向上成排地布置八个以上的螺栓,以免载荷分布过于不均。当螺栓联接承受弯矩或转矩时,应使螺栓的位置适当靠近联接接合面的边缘,以减小螺栓的受力(下图)。如果同时承受轴向载荷和较大的横向载荷时,应采用销,套筒,键等抗剪零件来承受横向载荷,以减小螺栓的预紧力及其结构尺寸。 接合面受弯矩或转矩时螺栓的布置
3)螺栓排列应有合理的间距,边距。布置螺栓时,各螺栓轴线间以及螺栓轴线和机体壁间的最小距离,应根据扳手所需活动空间的大小来决定。扳手空间的尺寸(下图)可查阅有关标准。对于压力容器等紧密性要求较高的重要联接,螺栓的间距t0不得大于下表所推荐的数值。 扳手空间尺寸 螺栓间距t0 注:表中d为螺纹公称直径。 4)分布在同一圆周上的螺栓数目,应取成4,6,8等偶数,以便在圆周上钻孔时的分度和画线。同一螺栓组中螺栓的材料,直径和长度均应相同。 5)避免螺栓承受附加的弯曲载荷。除了要在结构上设法保证载荷不偏心外,还应在工艺上保证被联接件,螺母和螺栓头部的支承面平整,并与螺栓轴线相垂直。对于在铸,锻件等的粗糙表面上应安装螺栓时,应制成凸台或沉头座(下图1)。当支承面为倾斜表面时,应采用斜面垫圈(下图2)等。
1.分析过程 1.1.理论分析 1.2.简化过程 如果将Pro/E中的3D造型直接导入Abaqus中进行计算,则会出现裂纹缝隙无法修补,给后期的有限元分析过程造成不必要的麻烦,因此,在Abaqs中进行计算之前,对原来的零件模型进行一些简化和修整。 A.法兰部分不是分析研究的重点,因此将其简化掉; B.经计算,M24×3的螺纹的升角很小,在度,因此可以假设螺旋升角为0; C.忽略螺栓和螺母的圆角等细节; 1.3.Abaqus中建模 查阅机械设计手册,得到牙型如下图所示,在Abaqus中按照下图所示创建出3D模型,如图1-1所示。同样的方式,我们建立螺母的3D模型nut,如图1-2所示。
图1-1 图1-2 建立材料属性并将其赋予模型。在Abaqus的Property模块中,选择Material->Manager->Create,创建一个名为Bolt&Nut的新材料,首先设置其弹性系数。在Mechanical->Elastic中设置其杨氏模量为193000Mpa,设置其泊松比为0.3,如图1-4所示。 建立截面。点击Section->Manager->Creat,建立Solid,Homogeneous的各向同性的截面,选择材料为Bolt&Nut,如图1-5所示。 将截面属性赋予模型。选择Assign->Section,选择Bolt模型,然后将刚刚建
立的截面属性赋予它。如图1-3所示。同样,给螺母nut赋予截面属性。 图1-3 图1-4
图1-5 然后,我们对建立的3D模型进行装配,在Abaqus中的Assembly模块中,我们同时调入两个模型,然后使用Constraint->Coaxial命令和Translate和Instance 命令对模型进行移动,最终的装配结果如图1-6所示。 图1-6 第四步,对模型进行网格划分。进入Abaqus中的Mesh模块,然后选择Bolt 零件,使用按边布种的方式对其进行布种,布种结果如图1-7所示。在菜单Mesh->Control中进行如图1-8所示的设置使用自由网格划分,其余设置使用默认。在菜单Mesh->Element type中选用如图1-9所示的设置。按下Mesh图标,对工件进行网格划分,最终的结果如图1-10所示。同样的方式对螺母模型nut 进行网格划分,最终结果见图1-11所示。
Abaqus分析报告 (齿轮轴) 名称:Abaqus齿轮轴 姓名: 班级: 学号: 指导教师:
一、简介 所分析齿轮轴来自一种齿轮泵,通过用abaqus软件对齿轮轴进行有限元分析和优化。齿轮轴装配结构图如图1,分析图1中较长的齿轮轴。 图1.齿轮轴装配结构图 二、模型建立与分析 通过part、property、Assembly、step、Load、Mesh、Job等步骤建立齿轮轴模型,并对其进行分析。 1.part 针对该齿轮轴,拟定使用可变型的3D实体单元,挤压成型方式。 2.材料属性 材料为钢材,弹性模量210Gpa,泊松比0.3。
3.截面属性 截面类型定义为solid,homogeneous。 4.组装 组装时选择dependent方式。 5.建立分析步 本例用通用分析中的静态通用分析(Static,General)。 6.施加边界条件与载荷 对于齿轮轴,因为采用静力学分析,考虑到前端盖、轴套约束,而且根据理论,对受力部分和轴径突变的部分进行重点分析。 边界条件:分别在三个轴径突变处采用固定约束,如图2。 载荷:在Abaqus中约束类型为pressure,载荷类型为均布载荷,分别施加到齿轮接触面和键槽面,根据实际平衡情况,两力所产生的绕轴线的力矩方向相反,大小按比例分配。 均布载荷比计算: 矩形键槽数据: 长度:8mm、宽度:5mm、高度:3mm、键槽所在轴半径:7mm 键槽压力面积:S1 = 8x3=24mm2 平均受力半径:R1=6.5mm 齿轮数据:= 齿轮分度圆半径:R2 =14.7mm、压力角:20°、 单个齿轮受力面积:S2 ≈72mm2 通过理论计算分析,S1xR1xP1=S2xR2xP2,其中,P1为键槽均布载荷
1 概述螺栓是机载设备设计中常用的联接件之一。其具有结构简单, 拆装方便,调整容易等优点, 被广泛应用于航空、航天、汽车以及各种工程结构之中。在航空机载环境下,由于振动冲击的影响,设备往往产生较大的过载,对作为紧固件的螺栓带来强度高要求。螺栓是否满足强度要求,关系到机载设备的稳定性和安全性。 传统力学的解析方法对螺栓进行强度校核,主要是运用力的分解和平移原理,解力学平衡方程,借助理论和经验公式,理想化和公式化。没有考虑到连接部件整体性、力的传递途径、部件的局部细节( 如应力集中、应力分布) 等等。通过有限元法,整体建模,局部细化,可以弥补传统力学解析的缺陷。用有限元分析软件 MSC.Patran/MSC.Nastran 提供的特殊单元来模拟螺栓连接,过程更方便,计算更精确,结果更可靠。因此,有限元在螺栓强度校核中的应用越来越广泛。 2 有限元模型的建立 对于螺栓的模拟,有多种模拟方法,如多点约束单元法和梁元法等。 多点约束单元法(MPC)即采用特殊单元RBE2来模拟螺栓连接。在螺栓连接处,设置其中一节点为从节点(Dependent) ,另外一个节点为主节点(Independent) 。主从节点之间位移约束关系使得从节点跟随主节点位移变化。比例因子选为1, 使从节点和主节点位移变化协调一致,从而模拟实际工作状态下,螺栓对法兰的连接紧固作用。 梁元法模拟即采用两节点梁单元Beam其能承受拉伸、剪切、扭转。通过参数设置,使梁元与螺栓几何属性一致。 本文分别用算例来说明这两种方法的可行性。 2.1 几何模型 如图 1 所示组合装配体,底部约束。两圆筒连接法兰通过8 颗螺栓固定。端面受联合载荷作用。
支架的线性静力学分析实例:建模和分析计算 在此实例中读者将学习ABAQUS/CAE的以下功能。 1) Sketch功能模块:导人CAD二维图形,绘制线段、圆弧和倒角,添加尺寸,修改平面图,输出平面图。 2) Part功能模块:通过拉伸来创建几何部件,通过切割和倒角未定义几何形状。 3) Property功能模块:定义材料和截面属性。 4) Mesh功能模块:布置种子,分割实体和面,选择单元形状、单元类型、网格划分 技术和算法,生成网格,检验网格质量,通过分割来定义承受载荷的面。 5) Assembly功能模块:创建非独立实体。 6) Step功能模块:创建分析步,设置时间增量步和场变量输出结果。 7) Interaction功能模块:定义分布榈合约束(distributing coupling constraint)。 8) Load功能模块:定义幅值,在不同的分析步中分别施加面载荷和随时间变化的集中力,定义边界条件。 9) Job功能模块:创建分析作业,设置分析作业的参数,提交和运行分析作业,监控运行状态。 10) Visualization功能模块:后处理的各种常用功能。 结构静力学分析(static analysis)是有限元法的基本应用领域,适用于求解惯性及阻尼对结构响应不显著的问题。主要用来分析由于稳态外载荷引起的位移,应力和应变等。本章的静力学分析实例按照ABAQUS工程分析的流程对支架进行线性静力学分析,通过实例基本掌握了分析的流程,同时了解接触的定义。 1.问题描述 所示的支架,一端牢固地焊接在一个大型结构上,支架的圆孔中穿过一个相对较软的杆件,圆孔和杆件用螺纹连接。材料的弹性模量E=2100000MPa,泊松比为0.3。
螺栓组受力分析与计算 螺栓组联接的设计 设计步骤: 1. 螺栓组结构设计 2. 螺栓受力分析 3. 确定螺栓直径 4. 校核螺栓组联接接合面的工作能力 5. 校核螺栓所需的预紧力是否合适 确定螺栓的公称直径后,螺栓的类型,长度,精度以及相应的螺母,垫圈等结构尺寸,可根据底板的厚度,螺栓在立柱上的固定方法及防松装置等全面考虑后定出。 "1.螺栓组联接的结构设计 螺栓组联接结构设计的主要目的,在于合理地确定联接接合面的几何形状和螺栓的布置形式,力求各螺栓和联接接合面间受力均匀,便于加工和装配。为此,设计时应综合考虑以下几方面的问题: 1)联接接合面的几何形状通常都设计成轴对称的简单几何形状,如圆形,环形,矩形,框形, 三角形等。这样不但便于加工制造,而且便于对称布置螺栓,使螺栓组的对称中心和联接接 合面的形心重合,从而保证接合面受力比较均匀。 2)螺栓的布置应使各螺栓的受力合理。对于铰制孔用螺栓联接,不要在平行于工作载荷的方向上成排地布置八个以上的螺栓,以免载荷分布过于不均。当螺栓联接承受弯矩或转矩时,应使螺栓的位置适当靠近联接接合面的边缘,以减小螺栓的受力(下图)。如果同时承受轴向载荷和较大的横向载荷时,应采用销,套筒,键等抗剪零件来承受横向载荷,以减小螺栓的预紧力及其结构尺寸。 塾〉不令 接合面受弯矩或转矩时螺栓的布置
3)螺栓排列应有合理的间距,边距。布置螺栓时,各螺栓轴线间以及螺栓轴线和机体壁间的 最小距离,应根 据扳手所需活动空间的大小来决定。扳手空间的尺寸(下图)可查阅有关标 准。对于压力容器等紧密性要求较高的重要联接, 螺栓的间距to 不得大于下表所推荐的数值 扳手空间尺寸 螺栓间距t o 注:表中d 为螺纹公称直径。 4) 分布在同一圆周上的螺栓数目,应取成 4, 6, 8等偶数,以便在圆周上钻孔时的分度和画 线。同一螺栓 组中螺栓的材料,直径和长度均应相同。 5) 避免螺栓承受附加的弯曲载荷。除了要在结构上设法保证载荷不偏心外,还应在工艺上保 证被联接件,螺 母和螺栓头部的支承面平整,并与螺栓轴线相垂直。对于在铸,锻件等的粗 糙表面上应安装螺栓时,应制成凸台或沉头座(下图 1)。当支承面为倾斜表面时,应采用 斜面垫圈(下图2)等。 1 ? 6*-4 4* 10 10* 1? 14-20 3W
第6章 螺纹联接 讨论 重点内容:受力分析、强度计算 。 难点:受翻转力矩的螺栓组联接。 附加内容:螺纹的分类和参数 1.螺纹的分类 2. 螺纹参数 (1) 螺纹大径d (2)螺纹小径d 1 (3)螺纹中径d 2 (4)螺距p (5)线数n (6)导程S (7)螺纹升角ψ (8)牙型角α 6.1 螺纹联接的主要类型、材料和精度 6.1.1螺纹联接的主要类型 松联接 根据装配时是否拧紧分 图6.1 紧联接 螺栓联接 螺钉联接 按紧固件不同分 双头螺柱联接 紧定螺钉联接 受拉螺栓联接 按螺栓受力状况分 受剪螺栓联接 6.1.2螺纹紧固件的性能等级和材料 性能等级:十个等级 B σ=点前数字 ×100 ; S σ=10×点前数字×点后数字。 材料:按性能等级来选。 例如:螺栓的精度等级6.8级 6.2 螺纹联接的拧紧与防松 ???外螺纹内螺纹? ??左旋螺纹 右旋螺纹 ?? ?多线螺纹单线螺纹?? ? ??锯齿形螺纹梯形螺纹三角螺纹?? ?传动螺纹 联接螺纹?? ?圆锥螺纹圆柱螺纹
6.2.1螺纹联接的拧紧 拧紧的目的: 拧紧力矩: 21T T T += 431T T T += T 1螺纹力矩: ()V t d F d F T ρψ+?=? =tan 2 22'21 T 2螺母支承面摩擦力矩:r F T ?=' 2μ 2 213 3 131d D d D r --?= 将6410~M M 的相关参数(2d ,ψ ,1D ,0d ) 代入且取 15.0arctan =V ρ得:d F d F k T T T t ' '212.0≈=+= 标准扳手的长度 L=15d d F Fd FL T '2.015===∴ (图 6.2……) F F 75' = 要求拧紧的螺栓联接应严格控制其拧紧力矩,且不宜用小于1612~M M 的螺栓。 测力矩扳手或定力矩扳手 控制拧紧力矩的方法: 用液压拉力或加热使螺栓伸长到所需的变形量 6.2.2 螺纹联接的防松 为何要防松? 自锁条件:ψ ABAQUS有限元接触分析的基本概念2009-11-24 00:06:28 作者:jiangnanxue 来源:智造网—助力中国制造业创新—https://www.doczj.com/doc/394138647.html, CAE(计算机辅助工程)是一门复杂的工程科学,涉及仿真技术、软件、产品设计和力学等众多领域。世界上几大CAE公司各自以其独到的技术占领着相应的市场。ABAQUS有限元分析软件拥有世界上最大的非线性力学用户群,是国际上公认的最先进的大型通用非线性有限元分析软件之一。它广泛应用于机械制造、石油化工、航空航天、汽车交通、土木工程、国防军工、水利水电、生物医学、电子工程、能源、地矿、造船以及日用家电等工业和科学研究领域。ABAQUS在技术、品质和可靠性等方面具有卓越的声誉,可以对工程中各种复杂的线性和非线性问题进行分析计算。 《ABAQUS有限元分析常见问题解答》以问答的形式,详细介绍了使用ABAQUS建模分析过程中的各种常见问题,并以实例的形式教给读者如何分析问题、查找错误原因和尝试解决办法,帮助读者提高解决问题的能力。 《ABAQUS有限元分析常见问题解答》一书由机械工业出版社出版。 16.1.1 点对面离散与面对面离散 【常见问题16-1】 在ABAQUS/Standard分析中定义接触时,可以选择点对面离散方法(node-to-surface-dis - cre-tization)和面对面离散方法(surface-to-surface discretization),二者有何差别? 『解答』 在点对面离散方法中,从面(slave surface)上的每个节点与该节点在主面(master surface)上的投影点建立接触关系,每个接触条件都包含一个从面节点和它的投影点附近的一组主面节点。 使用点对面离散方法时,从面节点不会穿透(penetrate)主面,但是主面节点可以穿透从面。 面对面离散方法会为整个从面(而不是单个节点)建立接触条件,在接触分析过程中同时考虑主面和从面的形状变化。可能在某些节点上出现穿透现象,但是穿透的程度不会很严重。 在如图16-l和图16-2所示的实例中,比较了两种情况。 螺栓组受力分析与计算 螺栓组受力分析与计算 一.螺栓组联接的设计 设计步骤: 1.螺栓组结构设计 2.螺栓受力分析 3.确定螺栓直径 4.校核螺栓组联接接合面的工作能力 5.校核螺栓所需的预紧力是否合适 确定螺栓的公称直径后,螺栓的类型,长度,精度以及相应的螺母,垫圈等结构尺寸,可根据底板的厚度,螺栓在立柱上的固定方法及防松装置等全面考虑后定出。 H1.螺栓组联接的结构设计 螺栓组联接结构设计的主要目的,在于合理地确定联接接合面的几何形状和螺栓的布置形式,力求各螺栓和联接接合面间受力均匀,便于加工和装配。为此,设计时应综合考虑以下几方面的问题: 1)联接接合面的几何形状通常都设计成轴对称的简单几何形状,如圆形,环形,矩形,框形, 三角形等。这样不但便于加工制造,而且便于对称布置螺栓,使螺栓组的对称中心和联接接合面的形心重合,从而保证接合面受力比较均匀。 2)螺栓的布置应使各螺栓的受力合理。对于铰制孔用螺栓联接,不要在平行于工作载荷的方 向上成排地布置八个以上的螺栓,以免载荷分布过于不均。当螺栓联接承受弯矩或转矩时,应使螺栓的位置适当靠近联接接合面的边缘,以减小螺栓的受力(下图)。如果同时承受轴向载荷和较大的横向载荷时,应采用销,套筒,键等抗剪零件来承受横向载荷,以减小螺栓的预紧力及其结构尺寸。 | 塾〉不令 接合面受弯矩或转矩时螺栓的布置 3)螺栓排列应有合理的间距,边距。布置螺栓时,各螺栓轴线间以及螺栓轴线和机体壁间的最小距离,应根据扳手所需活动空间的大小来决定。扳手空间的尺寸(下图)可查阅有关标准。对于压力容器等紧密性要求较高的重要联接,螺栓的间距to不得大于下表所推 荐的数值。 扳手空间尺寸 螺栓间距t o 注:表中d为螺纹公称直径。 4)分布在同一圆周上的螺栓数目,应取成4, 6, 8等偶数,以便在圆周上钻孔时的分度和画线。同一螺栓组中螺栓的材料,直径和长度均应相同。 5)避免螺栓承受附加的弯曲载荷。除了要在结构上设法保证载荷不偏心外,还应在工艺上保证被联接件,螺母和螺栓头部的支承面平整,并与螺栓轴线相垂直。对于在铸,锻件等的粗糙表面上应安装螺栓时,应制成凸台或沉头座(下图1)。当支承面为倾斜表面时,应采用斜面垫圈(下图2)等。 螺栓组受力分析与计算 一.螺栓组联接得设计 设计步骤: 1.螺栓组结构设计 2.螺栓受力分析 3.确定螺栓直径 4.校核螺栓组联接接合面得工作能力 5.校核螺栓所需得预紧力就是否合适 确定螺栓得公称直径后,螺栓得类型,长度,精度以及相应得螺母,垫圈等结构尺寸,可根据底板得厚度,螺栓在立柱上得固定方法及防松装置等全面考虑后定出。 1、螺栓组联接得结构设计 螺栓组联接结构设计得主要目得,在于合理地确定联接接合面得几何形状与螺栓得布置形式,力求各螺栓与联接接合面间受力均匀,便于加工与装配。为此,设计时应综合考虑以下几方面得问题: 1)联接接合面得几何形状通常都设计成轴对称得简单几何形状,如圆形,环形,矩形,框形,三角形等。这样不但便于加工制造,而且便于对称布置螺栓,使螺栓组得对称中心与联接接合面得形心重合,从而保证接合面受力比较均匀。 2)螺栓得布置应使各螺栓得受力合理。对于铰制孔用螺栓联接,不要在平行于工作载荷得方向上成排地布置八个以上得螺栓,以免载荷分布过于不均。当螺栓联接承受弯矩或转矩时,应使螺栓得位置适当靠近联接接合面得边缘,以减小螺栓得受力(下图)。如果同时承受轴向载荷与较大得横向载荷时,应采用销,套筒,键等抗剪零件来承受横向载荷,以减小螺栓得预紧力及其结构尺寸。 接合面受弯矩或转矩时螺栓得布置 3)螺栓排列应有合理得间距,边距。布置螺栓时,各螺栓轴线间以及螺栓轴线与机体壁间得最小距离,应根据扳手所需活动空间得大小来决定。扳手空间得尺寸(下图)可查阅有关标准。对于压力容器等紧密性要求较高得重要联接,螺栓得间距t0不得大于下表所推荐得数值。 扳手空间尺寸 螺栓间距t0 注:表中d为螺纹公称直径。 4)分布在同一圆周上得螺栓数目,应取成4,6,8等偶数,以便在圆周上钻孔时得分度与画线。同一螺栓组中螺栓得材料,直径与长度均应相同。 5)避免螺栓承受附加得弯曲载荷。除了要在结构上设法保证载荷不偏心外,还应在工艺上保证被联接件,螺母与螺栓头部得支承面平整,并与螺栓轴线相垂直。对于在铸,锻件等得粗糙表面上应安装螺栓时,应制成凸台或沉头座(下图1)。当支承面为倾斜表面时,应采用斜面垫圈(下图2)等。 Abaqus有限元分析中的沙漏效应[转] 2011-09-21 17:34:27| 分类:有限元 | 标签: |字号大中小订阅 1. 沙漏的定义 沙漏hourglassing一般出现在采用缩减积分单元的情况下: 比如一阶四边形缩减积分单元,该单元有四个节点“o”,但只有一个积 分点“*”。而且该积分点位于单元中心位置,此时如果单元受弯或者受剪,则必然会发生变形,如下图a所示。 关于沙漏问题,建议看看abaqus的帮助文档,感觉讲的非常好,由浅入深,把深奥的东西讲的很容易理解。 沙漏的产生是一种数值问题,单元自身存在的一种数值问题,举个例子,对于单积分点线性单元,单元受力变形没有产生应变能--也叫0能量模式,在 这种情况下,单元没有刚度,所以不能抵抗变形,不合理,所以必须避免这种情况的出现,需要加以控制,既然没有刚度,就要施加虚拟的刚度以限制沙漏 模式的扩展---人为加的沙漏刚度就是这么来的。 关于沙漏现象的判别,也就是出现0能模式的方法最简单的是察看单元变 形情况,就像刚才所说的单点积分单元,如果单元变成交替出现的梯形形状, 如果多个这样的单元叠加起来,是不是象我们windows中的沙漏图标呢? ABAQUS中沙漏的控制: *SECTION CONTROLS:指定截面控制 警告:对于沙漏控制,使用大于默认值会产生额外的刚度响应,甚至当值 太大时有时导致不稳定。默认沙漏控制参数下出现沙漏问题表明网格太粗糙, 因此,更好的解决办法是细化网格而不是施加更大的沙漏控制。 该选项用来为减缩积分单元选择非默认的沙漏控制方法,和standard中的修正的四面体或三角形单元或缩放沙漏控制的默认系数;在explicit中,也 为8节点块体单元选择非默认的运动方程:为实体和壳选择二阶方程、为实体 单元激活扭曲控制、缩放线性和二次体积粘度、设置当单元破损时是否删除他们、或为上述完全破损的单元指定一标量退化参数。等 必需参数: NAME:名字 可选参数: DISTORTION CONTROL:只用于explicit分析。=YES激活约束防止负体积 单元出现或其他可压缩材料的过度变形,这对超弹材料是默认的。DISTORTION 螺纹连接受力分析 一、 螺纹强度校核 把螺母的一圈螺纹沿大径展开,螺杆的一圈螺纹沿小径展开,视为悬臂梁,如图。 相关参数: 轴向力F ,旋合螺纹圈数z (因为旋合的各圈螺纹牙受力不均,因而z 不宜大于10); 螺纹牙底宽度b ,螺纹工作高度h ,每圈螺纹牙的平均受力为F z ,作用在中径上。 螺母——内螺纹,大径、中径、小径分别为D 、2D 、1D 。 螺杆——外螺纹,大径、中径、小径分别为d 、2d 、1d 。 1. 挤压强度 螺母一圈挤压面面积为2D h π,螺杆一圈挤压面积为2d h π。 螺母挤压强度2[]p p F F z A D h πσ= =≤σ 螺杆挤压强度2[]p p F F z A d h σσπ= =≤ p σ为挤压应力, []p σ 为许用挤压应力。 2. 剪切强度 螺母剪切面面积为Db π,螺杆剪切面面积1d b π。 螺母,剪切强度[]F F z A Db ττπ= =≤ 螺母的一圈沿大径展开 螺杆的一圈沿小径展开 螺杆,剪切强度1[]F F z A d b ττπ= =≤ []0.6[]τσ=,[]s n σσ= 为材料许用拉应力,s σ为材料屈服应力。 安全系数,一般取3~5。 3. 弯曲强度 危险截面螺纹牙根部,A -A 。 螺母,弯曲强度23[]b b M Fh W Db z σσπ= =≤ 螺杆,弯曲强度213[]b b M Fh W d b z σσπ= =≤ 其中,L :弯曲力臂,螺母22D D L -= ,螺杆2 2 d d L -= M :弯矩,螺母22D D F M F L z -=?= ?,螺杆2 2 d d F M F L z -=?=? W :抗弯模量,螺母2 6 Db W π= ,螺杆2 16 d b W π= []b σ:螺纹牙的许用弯曲应力,对钢材,[]1~1.2[]b σσ= 4. 自锁性能 自锁条件v ψψ≤, 其中,螺旋升角22 arctan arctan S np d d ψππ==,螺距、导程、线数之间关系:S =np ; 当量摩擦角arctan arctan cos v v f f ψβ ==, 当量摩擦系数cos v f f β= f 为螺旋副的滑动摩擦系数,无量纲,定期润滑条件下,可取0.13~0.17; β为牙侧角,为牙型角α的一半,2βα= 5. 螺杆强度 1、 实心 第39卷第1期建筑结构2009年1月 高强度螺栓连接的设计计算 蔡益燕 (中国建筑标准设计研究院,北京100044) 1高强度螺栓连接的应用 高强度螺栓连接分为摩擦型和承压型。《钢结构 (G设计规范》B50017—2003)(简称钢规)指出目前制 造厂生产供应的高强度螺栓并无用于摩擦型和承压型连接之分”因高强度螺栓承压型连接的剪切变形比摩擦型的大,所以只适用于承受静力荷载和间接承受动力荷载的结构”。因为承压型连接的承载力取决于钉杆剪断或同一受力方向的钢板被压坏,其承载力较之摩擦型要高出很多。最近有人提出,摩擦面滑移量不大,因螺栓孔隙仅为115?2mm,而且不可能都偏向一侧,可以用承压型连接的承载力代替摩擦型连接的,对结构构件定位影响不大,可以节省很多螺栓,这算一项技术创新。下面谈谈对于这个问题的认识。 在抗震设计中,一律采用摩擦型;第二阶,摩擦型连接成为承压型连接,要求连接的极限承载力大于构件的塑性承载力,其最终目标是保证房屋大震不倒。如果在设计内力下就按承压型连接设计,虽然螺栓用量省了,但是设计荷载下承载力已用尽。如果来地震,螺栓连接注定要破坏,房屋将不再成为整体,势必倒塌。虽然大部分地区的设防烈度很低,但地震的发生目前仍无法准确预报,低烈度区发生较高烈度地震的概率虽然不多,但不能排除。而且钢结构的尺寸是以mm计的,现代技术设备要求精度极高,超高层建筑的安装精度要求也很高,结构按弹性设计允许摩擦面滑移,简直不可思议,只有摩擦型连接才能准确地控制结构尺寸。总体说来,笔者对上述建议很难认同。2高强度螺栓连接设计的新进展 钢规的715节连接节点板的计算”中,提出了支撑和次梁端部高强度螺栓连接处板件受拉引起的剪切破坏形式(图1),类似破坏形式也常见于节点板连接,是对传统连接计算只考虑螺栓杆抗剪和钉孔处板件承压破坏的重要补充。 1994年美国加州北岭地震和1995年日本兵库县南部地震,是两次地震烈度很高的强震,引起大量钢框架梁柱连接的破坏,受到国际钢结构界的广泛关注。 1.梁C 的主要参数: 其中:梁长3000mm ,高为406mm ,上下部保护层厚度为38mm ,纵筋端部保护层厚度为25mm 抗压强度:35.1MPa 抗拉强度:2.721MPa 受拉钢筋为2Y16,受压钢筋为2Y9.5,屈服强度均为440MPa 箍筋:Y7@102,屈服强度为596MPa 2.混凝土及钢筋的本构关系 1、运用陈光明老师的论文(Chen et al. 2011)来确定混凝土的本构关系: 受压强度: 其中C a E ==28020,c f ρσ'=,0.002ρε= 2、受压强度与开裂位移的相互关系: 其中123.0, 6.93c c == 3、损伤因子: 其中c h = e=10(选取网格为10mm ) 4、钢筋取理想弹塑性 5、名义应力应变和真实应力及对数应变的转换: ln (1)ln(1)true nom nom Pl true nom E σσεσε ε=+=+- 6、混凝土最终输入的本构关系如下: compressive behavior tensile behavior tension damage yield stress inelastic strain yield stress displacement parameter displacement 21.50274036 2.721 25.56359281 2.72247E-05 2.683556882 0.0003129 0.18766492 0.0003129 28.88477336 8.85105E-05 2.646628319 0.0006258 0.31902609 0.0006258 31.43501884 0.000177278 2.610210508 0.0009387 0.41606933 0.0009387 33.24951537 0.000292271 2.574299562 0.0012516 0.49065237 0.0012516 34.40787673 0.000430648 2.538891515 0.0015645 0.54973463 0.0015645 35.01203181 0.000588772 2.503982327 0.0018774 0.5976698 0.0018774 35.16872106 0.000762833 2.46956789 0.0021903 0.63732097 0.0021903 34.97805548 0.000949259 2.435644029 0.0025032 0.67064827 0.0025032 34.52749204 0.001144928 2.402206512 0.0028161 0.69903885 0.0028161 33.88973649 0.001347245 2.369251048 0.003129 0.72350194 0.003129 33.17350898 0.001541185 2.336773294 0.0034419 0.74478941 0.0034419 32.38173508 0.001737792 2.30476886 0.0037548 0.76347284 0.0037548 31.54367693 30.68161799 0.001936023 0.002135082 2.27323331 2.242162167 0.0040677 0.0043806 0.77999451 0.79470205 0.0040677 0.0043806 北京力学会第18届学术年会论文集:工程应用 螺栓连接薄板应力的有限元分析 王升涛张建宇 (北京航空航天大学航空科学与工程学院,100191) 摘要:用ANSYS 软件对带预紧力和装配应力的螺栓连接薄板应力分布进行有限元分析。针 对连接件不同约束条件,计算得到薄板受拉时预紧力对螺栓孔处等效应力的影响。 关键词:预紧力,接触,螺栓连接,有限元分析 一、 引言 带预紧力和装配应力的螺栓连接是飞机结构中的常见连接形式。预紧力的存在使被连接的构件之间存在摩擦力的作用,导致了构件之间力的相互作用变得复杂。本文应用有限元分析研究了螺栓孔附近应力的几种影响因素。 二、 有限元模型及计算结果 连接结构如图1,由两块较长的薄板搭接在一起,采用纵向排列的两个沉头螺栓联接。薄板材料为铝合金,弹性模量取为70GPa ,泊松比取为0.33,螺栓材料为合金钢,弹性模量取为200GPa ,泊松比取为0.3。 图1 螺栓连接结构 为了更精确地模拟螺栓连接的力学行为和应力分布,划分网格之后,在模型中创建了9个接触对。模型中装配应力的施加是通过在接触对上设定初始干涉来实现的,而预应力的施加是通过降低螺栓的温度实现的。假设连接件一端固支,另一端受均布拉力q 的作用,几何尺寸固定不变,并假定装配应力为某一固定值不变,分别对以下两种情况进行了有限元分析:(1)薄板上下表面自由。(2)薄板不能发生弯曲。 情况(1)的计算结果汇总在图3-图5中,情况(2)结果汇总在图6-图7中,其中F 为预紧力,max σ为最大von Mises 应力,q 为板端均布拉力,k 为max σ与q 的比值。图3、 图6表明薄板表面的约束情况不同,应力分布也会有所不同,但最大von Mises 应力都出现在带沉孔板的螺栓孔孔壁上。图4表明在情况(1)下,一定范围内的预紧力对螺栓孔处的最大von Mises 应力没有明显影响。图5表明情况(1)下,螺栓孔处的最大应力随拉力的增加线性增加。图7表明在情况(2)下,预紧力对螺栓孔处最大von Mises 应力有较大影响;不同拉力水平下,预紧力对最大von Mises 应力的影响趋势相同,具体体现为:预紧力较小时,最大von Mises 应力较大,随着预紧力的增加,最大von Mises 应力减小,预紧力继续增加,最大von Mises 应力增大。 联接螺栓的强度计算方法 一.连接螺栓的选用及预紧力: 1、已知条件: 螺栓的s=730MPa 螺栓的拧紧力矩T=49N.m 2、拧紧力矩: 为了增强螺纹连接的刚性、防松能力及防止受载螺栓的滑动,装配时需要预紧。 其拧紧扳手力矩T用于克服螺纹副的阻力矩T1及螺母与被连接件支撑面间的摩擦力矩T2。装配时可用力矩扳手法控制力矩。 公式:T=T1+T2=K* F* d 拧紧扳手力矩T=49N.m 其中K为拧紧力矩系数, F为预紧力N d为螺纹公称直径mm 其中K为拧紧力矩系数, F为预紧力N d为螺纹公称直径mm 摩擦表面状态K值 有润滑无润滑 精加工表面0.1 0.12 一般工表面0.13-0.15 0.18-0.21 表面氧化0.2 0.24 镀锌0.18 0.22 粗加工表面- 0.26-0.3 取K=0.28,则预紧力 F=T/0.28*10*10-3=17500N 3、承受预紧力螺栓的强度计算: 螺栓公称应力截面面积As(mm)=58mm2 外螺纹小径d1=8.38mm 外螺纹中径d2=9.03mm 计算直径d3=8.16mm 螺纹原始三角形高度h=1.29mm 螺纹原始三角形根部厚度b=1.12mm 紧螺栓连接装配时,螺母需要拧紧,在拧紧力矩的作用下,螺栓除受预紧力F0的拉伸而产生拉伸应力外,还受螺纹摩擦力矩T1的扭转而产生扭切应力,使螺栓处于拉伸和扭转的复合应力状态下。 螺栓的最大拉伸应力σ1(MPa)。 1s F A σ==17500N/58*10-6m 2=302MPa 剪切应力: =0.51σ=151 MPa 根据第四强度理论,螺栓在预紧状态下的计算应力: =1.3*302=392.6 MPa 强度条件: =392.6≤730*0.8=584 预紧力的确定原则: 拧紧后螺纹连接件的预紧应力不得超过其材料的屈服极限s σ的80%。 () 203 1tan 2 16 v T d F T W d ?ρτπ += = 1.31ca σσ≈[] 02 11.34F ca d σσπ =≤ 问题一: 工字梁弯曲 1.1 问题描述: 在<<材料力学实验>>中,弯曲实验測定了工字梁弯曲应变大小及其分布,以验证弯曲正应力公式。在这里,採用ABAQUS/CAE建立试验件的有限元模型,ABAQUS/Standard模块进行分析求解,得到应力、应变分布,对比其与理论公式计算值及实验測量值的差別。 弯曲实验的相关数据: 材料:铝合金E=70GPa 泊松比0.3 实验装置结构简图如图所示: 结构尺寸测量值:H=50(+/-0.5mm) h=46(+/-0.5mm) B=40(+/-0.5mm) b=2(+/-0.02mm) a=300(+/-1mm) F1=30N Fmax=300N N ? F100 = 1.2 ABAQUS有限元建模及分析 一对象: 工字型截面铝合金梁 梁的结构简图如图1所示,結构尺寸、载荷、約束根据1.1设定,L取1600mm,两端各伸出100mm。 二用ABAQUS/CAE建立实验件的有限元模型,效果图如下: 边界条件简化: 左侧固定铰支座简化为下表面左参考点处的约束U1=U2=U3=0 右侧活动铰支座简化为下表面右参考点处的约束U1=U2=UR3=0 几何模型 有限元模型 三ABAQUS有限元分析結果 ①应力云图(Z方向正应力分量):施加载荷前 F=300N ②应变(Z方向分量): 中间竖直平面的厚度方向应变分布图: F=100N F=200N F=300N 由上图可以看出应变沿着厚度方向呈线性比例趋势变化,与实验测得的应变值变化趋势相同。中性轴处应变均接近零值,应变与距离中性轴位移基本为正比关系。 1.3分析结果: 中间竖直截面上下边缘轴向应力数值对比:*10^-6 MPa 距中性轴距ABAQUS模拟实验测量值平均理论值 1/2H -96.182*70000 -97*70000 -6.9165=-70000*98.807 -1/2H 95.789*70000 92*70000 6.9165ABAQUS有限元接触分析的基本概念
螺栓组受力分析与计算..
螺栓组受力分析与计算
Abaqus有限元分析中的沙漏效应
螺纹连接受力分析
高强度螺栓连接的设计计算.
abaqus有限元分析简支梁
螺栓连接薄板应力的有限元分析
联接螺栓强度计算方法
abaqus有限元建模小例子
相关主题
文本预览