
?Corresponding author.Tel.:+27-41-5042579;fax:+27-41-5042573.
E-mail address:ernest.vandyk@upe.ac.za(E.E.van Dyk).
0960-1481/$-see front matter#2004Elsevier Ltd.All rights reserved. doi:10.1016/j.renene.2004.04.016
acquisition system(DAS)capable of continuously monitoring the current–voltage (I–V)characteristics of seven modules,was designed,built and implemented at the University of Port Elizabeth,South Africa.Results obtained from monitoring I–V characteristics can be used to investigate and compare the actual power produced by modules under realistic operating conditions.The results may also be used for degradation and/or failure analysis.Studies have shown that in addition to the technology and material of the cells,the performance of PV modules is dependent on the environmental conditions at the site[4–6].The temperature and irradiance are some of the factors in?uencing the performance of PV modules outdoors.This paper reports on the design of a low-cost I–V sequencer system[7,8]that was used to monitor I–V characteristics of seven modules.Important results obtained from the monitoring of I–V characteristics between October2001and November2002 are presented and discussed.The in?uence of parameters such as temperature and irradiance on PV module performance is discussed and the energy production of the modules used in this study was also investigated.
2.Current–voltage sequencer system
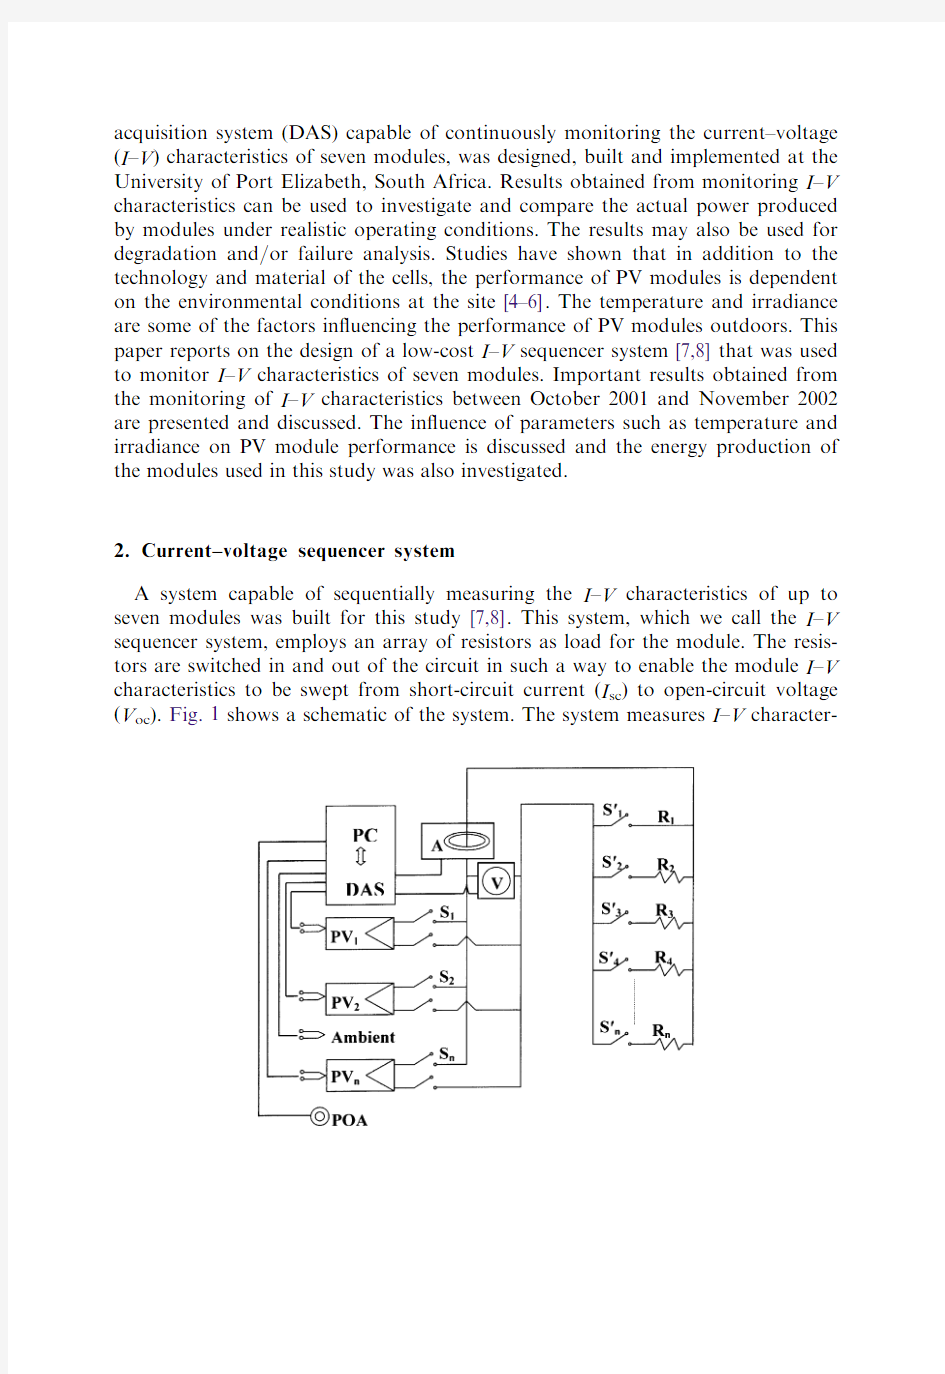
A system capable of sequentially measuring the I–V characteristics of up to seven modules was built for this study[7,8].This system,which we call the I–V sequencer system,employs an array of resistors as load for the module.The resis-tors are switched in and out of the circuit in such a way to enable the module I–V characteristics to be swept from short-circuit current(I sc)to open-circuit voltage (V oc).Fig.1shows a schematic of the system.The system measures I–V character-
istics of the di?erent modules sequentially by selecting a module through mechan-ical relays S1through S7.The relays S01through S016are used to select a parallel combination of resistors used as a resistive load for a particular I–V pair.We used a combination of resistors that allowed48desired resistances,and hence I–V pairs to be measured.
For an I–V curve to be traced,a particular module is selected by closing one of the relays S1through S7,while the rest of S1through S7remain open.Withall other relays(S01through S016)open,V oc of the selected module is measured with the voltage transducer,V.When S01is closed,the module is in a short-circuit con-dition and I sc is measured withth e current transducer,A.SwitchS01is then opened and the desired resistances obtained by sequentially selecting various combinations of relays S01through S016.At eachresistance value,I,V together with the plane of array(POA)irradiance are measured to obtain the full I–V characteristic.An example of an I–V characteristic of a single-crystalline silicon module,measured withth e I–V sequencer,is shown in Fig.2.Note that the resistance values are cho-sen to obtain a well-de?ned‘‘knee’’indicated by K in the?gure.To obtain a good spread of points around the‘‘knee’’,simulations under di?erent current ratings and various meteorological conditions were performed.This enabled us to select a set of resistance values that yielded as many I–V points as possible around the‘‘knee’’for eachPV module used in th e study.
The DAS comprises two plug-in computer cards;an ISA PC-73C temperature board and a PCI-30G A/D input/output board[9].The ISA PC-73C is a
thermocouple board consisting of an auxiliary board,which has cold junction compensation and thermocouple input terminals.This auxiliary card is connected to the PC back plane via an auxiliary DB25male connector.The PCI-30G card is used as an input/output(I/O)board for analog signals from sensors and for digital output from the software program to control relays.The board is interfaced to the analog signal lines and to the digital docking module(PC-43A2)by a 25-way A&D splitter cable.The interconnectivity of the cards is shown in Fig.3. The DAS collects data every15min,employing the A/D,relay and temperature cards in a computer.The current is measured using a Hall e?ect transducer,the voltage by a voltage transducer,the POA irradiance is measured using a CM6B Kipp&Zonen pyranometer,and temperatures are measured using cromel–alumel (type K)thermocouples.Irradiance is measured at each I–V point in order to o?set any changes in irradiance that may be caused by sudden cloud cover during measurement time.EachPV module’s I–V data are stored as separate text?les.A ?le of a particular PV module consists of97?elds that go into the database as one record.These?elds include each point on the I–V characteristic,irradiance measurements at each I–V point,temperature and the performance parameters;?ll-factor(FF),I sc,V oc,and current,voltage and power at maximum power (I max,V max,P max),and aperture area e?ciency.A program written in Hewlett
Packard’s Visual Engineering Environment (HPVEE)software is used to control all instruments and measure all signals.
3.PV modules monitored
The I –V curves of seven crystalline silicon modules were monitored for the period 1October 2001–30November 2002.The modules were mounted on a north facing rack witha latitude tilt (34v )and the I –V curves monitored using the I –V sequencer system.Table 1lists the modules used in this study.The modules were all manufactured using crystalline silicon cells;either single-crystalline (c-Si),multi-crystalline (mc-Si)or edge-de?ned ?lm-fed growth (EFG-Si).Also shown in the table is the rated and measured power at STC,and the aperture e?ciency of each module measured prior to commencement of monitoring.It is worthnoting th at all the modules had been deployed outdoors for various lengths prior to this study.This may account for the di?erences between rated and measured power as dis-cussed elsewhere [8].The purpose of this paper is not to compare rated power to measured power,but rather to illustrate the value of the information obtained by monitoring the I –V characteristics of the seven modules using the low-cost I –V sequencer.
4.Results and discussion
The value of monitoring the I –V characteristic of modules while deployed out-doors is that the performance under real operating conditions may be investigated and the e?ects of environmental conditions are taken into consideration by the monitoring.The e?ects of solar irradiance and temperature on performance parameters are discussed in detail elsewhere [10,11].These e?ects are shown in Figs.4–6.Fig.4shows three I –V characteristics of mod1_c-Si measured at di?erent times of day.Also shown in the ?gure are irradiance and module temperature values,and the maximum power produced by the module.There is a linear increase in photo-generated current with increased photon ?ux as irradiance levels Table 1
Modules monitored outdoors.The rated and measured powers are at STC,also shown are the module aperture area e?ciencies
Module
Rated P max (W)Measured P max (W)E?ciency (%)Mod1_c-Si
4846.111.3Mod2_mc-Si
5047.010.8Mod3_c-Si
7063.79.4Mod4_c-Si
8072.110.6Mod5_mc-Si
8073.610.7Mod6_mc-Si
7971.610.4Mod7_EFG-Si 5048.612.5
403
E.E.van Dyk et al./Renewable Energy 30(2005)399–411
increase[12],resulting in the observed increase in current and power produced by the module with increased irradiance.The decrease in V oc withincrease tempera-ture is also clearly illustrated in the?gure.The logarithmic dependence of voltage on irradiance level[13]is shown in Fig.5which depicts I sc and V oc plotted as a function of time of day for mod1_c-Si on21January2002.For clarity,irradiance is omitted as it follows the same symmetrical distribution before and after solar noon as I sc.At solar noon,which is12:22p.m.for the data shown,the amount of irradiance received by the module is at its maximum;hence I sc is also at its maximum.There is,however,a drop in V oc around solar noon,which may be attributed to the elevated temperatures at this time of the day.The e?ect of temperature on the I–V parameters is illustrated by Fig.6,which shows the I–V characteristics of mod1_c-Si,measured around noon on di?erent days when the module temperature was37and46v C.The I–V characteristics measured at37v C was traced on22November2002and that at46v C on11January2002.Both I–V characteristics in the?gure are normalized to1000W/m2.Also shown in the?gure are the respective I–V parameters at the37and46v C.Withreference to th e table in Fig.6,it is clear that V oc is more temperature dependent than I sc.The large drop in voltage(h V)due to9v C increase in temperature as illustrated by the6.3% drop in V oc which is not compensated for by the relatively small increase in cur-
rent,h I(1.6%in I sc),resulting in a reduction in P max of5.1%.If not taken into
account,excessive temperatures coupled withvariation in irradiation,can lead to under-designing of PV systems,which in turn may lead to system failure[6,7].
In order to compare the module performance over the monitoring period,the module energy produced per unit area,operational e?ciency and average monthly energy per unit area per day were calculated[8].The operational e?ciency is de?ned as the energy produced per unit aperture area expressed as a percentage of incident irradiation.The aperture area is taken to be the area of the exposed glass surface of a module.
Fig.7shows a plot of average daily energy produced during the monitoring per-iod October2001–November2002.In the?gure,for clarity,only the energy pro-duced by three of the modules,representing the three di?erent technologies (mod1_c-Si,mod5_mc-Si,and mod7_EFG-Si),is shown together with the incident irradiation.It is clear in the?gure that there is a great variation in energy pro-duced from day to day due to the?uctuations in daily irradiation and other meteorological parameters suchas temperature.Th ese?uctuations were also observed for all the other modules.The gaps in the dataset correspond to the days when PV modules were taken down for indoor testing or other experiments. The seasonal variation caused mainly by fewer sunshine hours in winter than in summer is also evident.Plots suchas th ose in Fig.7are useful for identifying how di?erent modules perform under di?erent meteorological conditions[14]and since all modules are subjected to the same conditions,a direct comparison of their
performance is therefore possible.An example of this type of comparison is that it is clear that mod7_EFG-Si was the best performer from the beginning of the monitoring period due to its superior e?ciency,but careful examination of the data reveals that there are signs of performance degradation for this module towards the end of the period.
Due to high?uctuations in daily irradiation,it is better to look at energy output versus irradiation,thereby obtaining a better comparison between the di?erent modules[1].Fig.8shows the average daily energy per unit area as a function of average daily irradiation for the same modules as in Fig.7.Also shown in the?g-ure(inset)are the respective slopes of the least-squares?ts to the data.The linear relationship between energy produced and incident irradiance is clearly demon-strated in the?gure.The scatter in the data is due to changes in meteorological conditions resulting in spectral variation and temperature changes at the speci?c measured irradiances.Module degradation would also contribute to increased scatter in the data due to lower energy output.The slopes of the least-squares?ts which are representative of the e?ciency are therefore good indicators of the over-all module performance and enable one to directly evaluate how modules perform under varying irradiance while deployed outdoors.From the?gure,one is able to determine how the modules will perform on average over a long time and rank their performance.It is again clear that mod7_EFG-Si is the best performer
(highest slope),followed by mod1_c-Si,and then mod5_mc-Si.It must,however, be noted that although this analysis gives an overall idea of operational e?ciency, it does not explicitly show degradation in performance.There is a degradation of about8%in the performance of mod7_EFG-Si,which may contribute to some scatter in the data shown in Fig.8,particularly due to data collected towards the end of the monitoring period.This degradation,however,does not a?ect the analysis in this study.For the other modules,there was no meaningful degradation as discussed below.
In addition to the above analysis,photovoltaic system designers and installers can use energy data and operational e?ciencies as presented in Figs.9and10,and Table2to their advantage.Fig.9shows the average monthly energy per unit area per day of the three modules used in the discussion above.Also shown in the?g-ure,for comparison,is the average monthly irradiation per day.The?gure gives a good visual indication of the normalized energy production of the modules.The data of Fig.9may be used to determine operational e?ciencies.The monthly oper-ational e?ciencies for the three modules are shown in Fig.10,enabling the moni-toring of any degradation.From the?gure,it is clear that mod1_c-Si and mod5_mc-Si do not degrade during the monitoring period,while mod7_EFG-Si degrades by more than8%during this time.The degradation may be ascribed to the moisture ingress observed during visual inspection of the module[8].
An overall comparison of the modules’performances is possible by comparing the average operational e?ciencies of the modules during the monitoring period.
These operational e?ciencies are listed in Table 2.As expected,mod7_EFG-Si and mod1_c-Si performed well compared to other modules,with operational e?ciencies of 10.2%and 9.9%,respectively.The operational e?ciencies are,however,well below than those measured indoors as listed in Table 1.This is due to environmen-tal factors suchas elevated temperatures,ch anging irradiation level,and varying spectral conditions.This shows that STC at which modules are usually speci?ed are hardly,if ever realized outdoors [14].As discussed above,operational e?-ciencies calculated for the entire monitoring period give an overall indication of the performance during monitoring and do not give any indication of degradation
as Table 2
Average operational e?ciencies of the seven modules for the period between October 2001and November 2002
Module
Operational e?ciency (%)Mod1_c-Si
9.9Mod2_mc-Si
9.5Mod3_c-Si
7.6Mod4_c-Si
9.2Mod5_mc-Si
7.5Mod6_mc-Si
8.7Mod7_EFG-Si 10.2
409
E.E.van Dyk et al./Renewable Energy 30(2005)399–411
observed for mod7_EFG-Si.In this case,the module was,on average,the best per-former with the highest overall operational e?ciency,but showed signs of degra-dation.It is,therefore,essential that performance be monitored and that performance data are thoroughly analyzed as monitoring performance parameters is the best way to determine overall module output performance and to detect if there is any degradation.
5.Summary and conclusion
The main objective of this study was to demonstrate the value of the low-cost I –V sequencer.The design and implementation of the low-cost I –V sequencer sys-tem capable of monitoring up to seven PV modules was presented and discussed.The system was used to monitor the I –V characteristics of PV modules under realistic outdoor conditions between October 2001and November 2002.The data obtained showed the value of monitoring PV modules as the performance of a particular cell technology type could be tracked over time.The monitoring also yielded useful results on how each PV module performed over an extended period of time withregard to energy generating capability and operational e?ciencies.Although secondary to this study,degradation of PV modules can also be determ-ined using this system.
With regard the modules monitored,we were able to use the data obtained to rank the modules in terms of how they performed during the monitoring period.The energy produced by the modules showed great variation from day to day due to highly variable meteorological conditions at the site.Even though mod7_EFG-Si showed signs of degradation,it was the best performer with overall outdoor operational e?ciency of 10.2%.It was followed by mod1_c-Si with9.9%oper-ational e?ciency.This paper successfully emphasizes the importance of outdoor performance monitoring as there was a signi?cant di?erence between indoor and outdoor measurements.Data obtained in this study can be used by system design-ers and consumers to correctly design and use photovoltaic systems.
Acknowledgements
The authors wish to thank the South African National Research Foundation,the South African Department of Trade and Industry,and Eskom for their ?nan-cial support.
References
[1]del Cueto https://www.doczj.com/doc/1c18430430.html,parison of energy production and performance from ?at plate photovoltaic
module technologies deployed at ?xed tilt.Proceedings of the 29th IEEE Photovoltaic Specialists Conference.2002,p.1523–6.
[2]Meyer EL,van Dyk EE.Degradation analysis of silicon photovoltaic modules.Proceedings of the
16thEuropean Ph otovoltaic Solar Energy Conference.2000,p.2272–5.
E.E.van Dyk et al./Renewable Energy 30(2005)399–411
410
[3]van Dyk EE,Meyer EL,Scott BJ,O’Connor DA,Wessels JB.Analysis of photovoltaic module
energy output under operating conditions in South Africa.Proceedings of the 26th IEEE Photo-voltaic Specialists Conference.1997,p.1197–200.
[4]King DL,Boyson WE,Kratochvil JA.Analysis of factors in?uencing the annual energy production
of photovoltaic systems.Proceedings of the 28th IEEE Photovoltaic Specialists Conference.2002,p.1525–8.
[5]Meyer EL,van Dyk EE.The behaviour of photovoltaic modules under reduced light levels.Pro-
ceedings of the 17th European Photovoltaic Solar Energy Conference.2001,p.528–31.
[6]van Dyk EE,Meyer EL.Long-term monitoring of photovoltaic modules in South Africa.Proceed-
ings of the 28th IEEE Photovoltaic Specialists Conference.2000,p.1525–8.
[7]van Dyk EE,Gxasheka AR,Meyer EL.Monitoring current–voltage characteristics of photovoltaic
modules.Proceedings of the 29th IEEE Photovoltaic Specialists Conference.2002,p.1516–9.
[8]Gxasheka AR.On the monitoring of current–voltage characteristics of photovoltaic modules.MSc
Dissertation,Department of Physics,University of Port Elizabeth,2003.
[9]Eagle Technology,2003.Available from:http://www.eagle.co.za/.
[10]van Dyk EE,Meyer EL,Vorster FJ,LeitchAWR.Renew Energy 2002;25/2:183–97.
[11]van Dyk EE,Scott BJ,Meyer EL,LeitchAWR.S Afr J Sci 2000;96:198.
[12]Lorenzo E.Solar electricity:engineering of photovoltaic systems [Davies P,Trans.].PROGENSA;
1994.
[13]Anderson CJ.Photovoltaic translation equations:a new approach.NREL Final Subcontract
Report No.DE-AC36-83CH10093,1996.
[14]Meyer EL,van Dyk EE.Renew Energy 2000;21:37–47.411
E.E.van Dyk et al./Renewable Energy 30(2005)399–411
激励机制设计的五个原则 建立激励机制必须要研究员工的需求,依照各种激励理论将不同的激励方法加以适当组合。只有对不同的情况区别对待,使用相应的激励手段,才能对企业团队和员工个人实施有效地激励。因此,民营企业要建立良好的人才激励机制,必须遵循物质激励与精神激励相结合、正激励与负激励相结合、长期激励与短期激励相结合、绩效原则、公平原则等基本原则,并且有所侧重,必须想方设法了解并满足员工多元化的个人心理需求,采取多种形式的激励手段,充分激发员工潜能,确保激励机制的合理性和实效性。 一、物质激励与精神激励相结合原则 从管理学上说,激励可分为两类:一类是物质激励,也叫薪酬激励;另一类是精神激励,又叫成长激励。物质激励与精神激励作为激励的两种不同类型,是相辅相承、缺一不可的,只强调物质激励而忽视精神激励或只强调精神激励而忽视物质激励都是片面和错误的。 在实际工作中,一些人总以为有钱才会有干劲,有实惠才能有热情,精神激励是水中月、镜中影,好看却不中用。正是这种片面的理解,致使一部分人斤斤计较、唯利是图,甚至弄虚作假、违法乱纪,给组织环境和社会风气都带来极大危害。另有一些人总爱把大道理挂在嘴边,只讲贡献不讲需要,只讲觉悟不讲利益,以为大家靠喝西北风也能有干劲,这些人恰恰忘了:“思想一旦离开利益,就一定会使自己出丑”。为了避免以上两种片面性的发生,防止“单打”现象的出现,在激励中一定要坚持物质激励与精神激励相结合的方针。 强调物质激励与精神激励相结合,并不是说不需要有所侧重,物质激励与精神激励是对人们物质需要和精神需要的满足,而人们的物质需要和精神需要在层次与程度上受多种因素的制约,并随主客观条件的发展而不断有所变化.从社会角度来看,一般来说,社会经济文化发展水平比较低,人们的物质需求就会比较强烈,而在社会经济文件发展水平比较高的条件下,人们的精神需要则会占主导地位。从个人角度来看,一个人受教育的程度、所从事的工作性质及其自身的品德修养也会对需要产生很大程度的影响。所以,不论从个人发展还是从社会发展
工程经济计算公式汇总0921 1、利息I=F=P I-利息;(interest) F-目前债务人应付总金额,即还本付息总额; P-原借贷金额,即本金。(Principal) 2、利率i=It/P I-利率 It-单位时间内所得的利息额 3、单利It=P×i单 It-第t计息周期的利息额;P-本金;i单-计息周期单利利率4、第n期末单利本利和F=P+In=P(1+n×i单) In-n个计息周期所付或所收的单利总利息 5、复利It=i×F t-1 I-计息周期复利利率;F t-1——表示第(t-1)期末复利本利和。 6、第t期末复利本利和F t=F t-1×(1+i) 7、净现金流量(CI-CO)t 8、一次支付n年末终值(即本利和)F=P(1+i)n 其中(1+i)n称之为一次支付终值系数 9、等额支付系列现金流量 P=A1(1+i)-1+A2(1+i)-2+......+A n(1+i)-n=∑A t(1+i)-t F=∑A t(1+i)n-t=A[(1+i)n-1]/i 其中At=A=常数t=1,2,3,......,n A表示年金,发生在某一特定时间序列各计息期末(不包括零期)的等额资金序列的价值。 [(1+i)n-1]/1 称为等额支付系列终值系数或年金终值系数 10、名义利率r=i×m I-周期利率;m-计息周期数;r-名义利率 i=r/m 年本利和F=P(1+r/m)m 年利息I=f-P=P[(1+r/m)m-1] 年有效利率ieff=I/P=(1+r/m)m-1 11、投资收益率R=A/I A-技术方案年净收益额或年平均净收益额;I-技术方案投资 12、基准投资收益率Rc R>Rc 技术方案可行 R 虚拟演播室是视频技术于计算机技术结合的产物,把计算机图形图像处理技术与传统的色键技术集合起来形成的。是一种新颖的独特的电视节目制作技术。 虚拟演播室技术原理:虚拟演播室技术与色键技术十分相像,他是由前景主持人为主的画面和背景画面,采用色键的方法构成一个整体,产生人物置身于背景中的组合画面。 虚拟演播室工作原理 虚拟演播室装修的总体要求: 建立一个功能完善的虚拟演播室,需要做到如下基本要求: 1、要求演播室的拾音空间首先具有较好的语言清晰度、可懂度,其次是要有良好的声音丰满度, 2、要求演播室内各处要有合适的响度和均匀度,具有相应的满足拾音要求的混响频率特性。 3、抑制影响听、拾音音质的声缺陷,防止出现声聚焦、驻波、颤动回声、低频嗡声等。 4、演播室内墙面的声学装饰考虑在装饰大方美观、造型新颖的基础上对于高中低各频段的声学处理方式,特别是低频段的声学处理方式方法。 演播室的建声指标:混响时间≤0.6S±0.05S;噪声评价曲线NR-30---NR-35。 设计的隔声门隔声量大于35dB并具有好的密封性。 5、演播室声学建声装饰所选用的材料符合国家相应的强制消防要求,要求采用达到B1、B2级标准的材料。 6、演播室声学建声装饰所选用的材料符合国家相应的强制环保要求,特别是要求甲醛的释放量为<0。1mg/m3。墙面装饰层内禁止使用不安全和危害性较高的吸声材料。 7、装饰踢脚线兼做视音频线槽并做屏蔽处理。 8、演播室配置录制指示灯和紧急逃生指示灯。 9、装饰层内的综合布线按要求做穿管处理。 10、演播室现有的位置南边部分为玻璃幕墙,不利于演播室的隔声,所以要对原幕墙部分进行隔断,制作隔声封闭处理,在保证整体装饰的美观性和隔声性的同时,还应保证演播室正常的通风换气。 11、导控室地面用防静电地板,装修过程中做好设备布线(强电,弱电),做好防雷,接地各类设施的设计施工。 12、装修预留好空调位置,并配合本台做好空调,配电等设备的安装施工。 等额本息和等额本金计算公式 等额本金: 本金还款和利息还款: 月还款额=当月本金还款+当月利息式1 其中本金还款是真正偿还贷款的。每月还款之后,贷款的剩余本金就相应减少: 当月剩余本金=上月剩余本金-当月本金还款 直到最后一个月,全部本金偿还完毕。 利息还款是用来偿还剩余本金在本月所产生的利息的。每月还款中必须将本月本金所产生的利息付清: 当月利息=上月剩余本金×月利率式2 其中月利率=年利率÷12。据传工商银行等某些银行在进行本金等额还款的计算方法中,月利率用了一个挺孙子的算法,这里暂且不提。 由上面利息偿还公式中可见,月利息是与上月剩余本金成正比的,由于在贷款初期,剩余本金较多,所以可见,贷款初期每月的利息较多,月还款额中偿还利息的份额较重。随着还款次数的增多,剩余本金将逐渐减少,月还款的利息也相应减少,直到最后一个月,本金全部还清,利息付最后一次,下个月将既无本金又无利息,至此,全部贷款偿还完毕。 两种贷款的偿还原理就如上所述。上述两个公式是月还款的基本公式,其他公式都可由此导出。下面我们就基于这两个公式推导一下两种还款方式的具体计算公式。 1. 等额本金还款方式 等额本金还款方式比较简单。顾名思义,这种方式下,每次还款的本金还款数是一样的。因此: 当月本金还款=总贷款数÷还款次数 当月利息=上月剩余本金×月利率 =总贷款数×(1-(还款月数-1)÷还款次数)×月利率 当月月还款额=当月本金还款+当月利息 =总贷款数×(1÷还款次数+(1-(还款月数-1)÷还款次数)×月利率) 总利息=所有利息之和 =总贷款数×月利率×(还款次数-(1+2+3+。。。+还款次数-1)÷还款次数) 其中1+2+3+…+还款次数-1是一个等差数列,其和为(1+还款次数-1)×(还款次数-1)/2=还款次数×(还款次数-1)/2 :总利息=总贷款数×月利率×(还款次数+1)÷2 由于等额本金还款每个月的本金还款额是固定的,而每月的利息是递减的,因此,等额本金还款每个月的还款额是不一样的。开始还得多,而后逐月递减。 等额本息还款方式: 等额本金还款,顾名思义就是每个月的还款额是固定的。由于还款利息是逐月减少的,因此反过来说,每月还款中的本金还款额是逐月增加的。 首先,我们先进行一番设定: 设:总贷款额=A 还款次数=B 还款月利率=C 月还款额=X 当月本金还款=Yn(n=还款月数) 先说第一个月,当月本金为全部贷款额=A,因此: 第一个月的利息=A×C 第一个月的本金还款额 Y1=X-第一个月的利息 促销活动中激励机制如何设置您的激励措施达到了激励目的了吗? 现今,很多商场在做大型促销活动的时候,均设置了动员与激励环节,以期望最大限度地调动活动参与人员的积极性,提高活动的接单量。大量的事实也证明,好的激励方案对活动的成功开展的确起到了积极的作用,值得肯定。但是,也出现了不少“无效激励”的现象,需要进行改良。 问题的关键是激励机制如何制定才能真正实现激发个人或团队斗志,提高团队协同作战能力、营造良好的分享氛围、提高活动接单量等,而不至于出现激励后遗症,这是管理者在制定激励方案时需要仔细斟酌和考量的。 激励措施的分类 激励按性质划分,一般分为正激励与负激励两种;按方式划分,一般分为物质奖励与精神奖励两种;按形式划分,一般分为团队激励与个人激励两种;按周期划分,一般分为短期激励与长期激励两种等等,形式多种多样,在此就不一一赘述。 仔细看了很多商场提交的活动方案,相当一部分的商场在活动期间的激励方案如下: 个人奖励:1—5单以上,奖励20元/单;6—10单以上,奖励30元/单;10—20单以上,奖励45元/单;21—30单以上,奖励60元/单;31—40单以上,奖励80元/单 集体奖励:完成目标180单,奖励集体漂流或旅游一次。 这种做法的好处是简单、易操作,但存在的弊端是过于简单,同时还存在很多漏洞,不一定能达到激励的目的。 制定激励方案 在制定激励方案时,须综合考虑目标可实现性、团队氛围、个人接单能力、活动力度(与自己以往比、与对手比)、活动宣传面、活动开展时间(淡季还是旺季)、以往所采用过的方式方法等因素,同时切忌简单的复制商场的激励方案,否则,就会出现有激励无动力的局面,达不到激励的目的。 总体目标的制定建议分三级设置:确保级(及格线)、力争级(成功线),冲击级(非常成功线),这样的好处是可望又可及。如:保60单、争80单、冲100单,再设置相应的奖励。 团队目标和个人目标的设定上,同样也采用三级别设置,这样的好处是能将总目标分解到具体的每个人,真正实现千斤重担人人挑,人人头上有指标。 一级建造师《建设工程经济》计算公式汇总 1、单利计算 式中It——代表第t计息周期的利息额;P——代表本金;i单——计息周期单利利率。 2、一次支付的终值和现值计算 ①终值计算(已知P求F即本利和) ②现值计算(已知F求P) 3、等额支付系列的终值、现值、资金回收和偿债基金计算 等额支付系列现金流量序列是连续的,且数额相等,即: ①终值计算(即已知A求F) ②现值计算(即已知A求P) ③资金回收计算(已知P求A) ④偿债基金计算(已知F求A) 4、名义利率r 是指计息周期利率:乘以一年内的计息周期数m所得的年利率。即: 5、有效利率的计算 包括计息周期有效利率和年有效利率两种情况。 (1)计息周期有效利率,即计息周期利率i,由式(1Z101021)可知(1Z101022-1) (2)年有效利率,即年实际利率。 年初资金P,名义利率为r,一年内计息m次,则计息周期利率为。根据一次支付终值公式可得该年的本利和F,即:根据利息的定义可得该年的利息I 再根据利率的定义可得该年的实际利率,即有效利率ieFF 6、财务净现值(1Z101035) 式中FNPV——财务净现值; (CI-CO)t——第t年的净现金流量(应注意“+”、“-”号); ic——基准收益率; n——方案计算期。 7、财务内部收益率(FIRR——FinanciallnternaIRateoFReturn) 其实质就是使投资方案在计算期内各年净现金流量的现值累计等于零时的折现率。其数学表达式为:(1Z101036-2) 式中FIRR——财务内部收益率。 8、投资收益率指标的计算 是投资方案达到设计生产能力后一个正常生产年份的年净收益总额(不是年销售收入)与方案投资总额(包括建设投资、建设期贷款利息、流动资金等)的比率:(1Z101032-1) VS-VSCENE 虚拟演播室系统方案建议书北京华视恒通系统技术有限公司 北京华视恒通系统技术有限公司 目栩 公司简介................................................................................................................................................................... 3.. . 惊)前悅........................................................................................................................................................................................ 4.. . . 二)系统方案设计.................................................................................................................................................. 4.. . 1、设计原则........................................................................................................................................... 4.. . 2、设计方案........................................................................................................................................... 5.. . 3、系统结构原枞图............................................................................................................................. 7.. . 4、系统功能特点 ................................................................................................................................ 1..0. 5、TOPACK-C抠K 像卡................................................................................................................ 1..2 6、TOPACK-CG/AUD旓IO幕混愃卡 ................................................................................ 1..3 三)软件系统功能................................................................................................................................................. 1..5. 1、系统参数设敢 ................................................................................................................................ 1..5. 2、抠像参数设敢 ................................................................................................................................ 1..7. 3、场景编排.......................................................................................................................................... 1..8. 4、实时控敥.......................................................................................................................................... 2..0. 5、远程旓幕客户端............................................................................................................................ 2..2. 四)设备悪本及效果图........................................................................................................................................ 2..3. 五)系统配敢........................................................................................................................................................................................ 2..4 . 售后服务措施及承诺 ............................................................................................................................................. 2..6. 等额本息还款公式推导 设贷款总额为A,银行月利率为β,总期数为m(个月),月还款额设为X,则各个月所欠银行贷款为: 第一个月A 第二个月A(1+β)-X 第三个月(A(1+β)-X)(1+β)-X=A(1+β)2-X[1+(1+β)]第四个月((A(1+β)-X)(1+β)-X)(1+β)-X =A(1+β)3-X[1+(1+β)+(1+β)2] … 由此可得第n个月后所欠银行贷款为 A(1+β)n –X[1+(1+β)+(1+β)2+…+(1+β)n-1]= A(1+β)n –X [(1+β)n-1]/β 由于还款总期数为m,也即第m月刚好还完银行所有贷款,因此有 A(1+β)m –X[(1+β)m-1]/β=0 由此求得 X = Aβ(1+β)m /[(1+β)m-1] ======================================================= ===== ◆关于A(1+β)n –X[1+(1+β)+(1+β)2+…+(1+β)n-1]= A(1+β)n –X[(1+β)n-1]/β的推导用了等比数列的求和公式 ◆1、(1+β)、(1+β)2、…、(1+β)n-1为等比数列 ◆关于等比数列的一些性质 (1)等比数列:An+1/An=q, n为自然数。 (2)通项公式:An=A1*q^(n-1); 推广式:An=Am·q^(n-m); (3)求和公式:Sn=nA1(q=1) Sn=[A1(1-q^n)]/(1-q) (4)性质: ①若m、n、p、q∈N,且m+n=p+q,则am·an=ap*aq; ②在等比数列中,依次每k项之和仍成等比数列. (5)“G是a、b的等比中项”“G^2=ab(G≠0)”. (6)在等比数列中,首项A1与公比q都不为零. ◆所以1+(1+β)+(1+β)2+…+(1+β)n-1 =[(1+β)n-1]/β 等额本金还款不同等额还款 问:等额本金还款是什么意思?与等额还款相比是否等额本金还款更省钱? 封面 作者:ZHANGJIAN 仅供个人学习,勿做商业用途 员工激励机制方案 人力资源是现代企业的战略性资源,也是企业发展的最关键的因素,而激励开发是人力资源的重要手段。企业实行激励机制的最根本的目的是正确地诱导员工的工作动机,使他们在实现组织目标的同时实现自身的需要,增加其满意度,从而使他们的积极性和创造性保持和发扬到最佳状态。建立一套科学有效的激励机制直接关系企业的生存和发展。在企业激励机制的创建中,不能忽视人的需要的作用,只有建立以人为本的激励机制,才能使其在企业的生存和发展中发挥巨大的作用。 一、员工的基本需要(本中心的工资激励制度) 激励来源于需要。作为企业的经营者首先应该了解员工除了薪酬和福利待遇等最基本的需要之外还存在着如安全的需要、归属的需要、社会的需要、自我价值实现的需要等多方面的需求。物质需要仅仅是员工基本需要的一个方面。实际上员工的需要是多种多样的,不同的人有不同的需要,员工共同的需要就是企业的需要。人们有了需求才会有动力,当然员工的需求必须是他经过努力后才能达到的,这样才能起到激励的作用。因此,建立合理有效的激励机制,就必须根据员工的需要对激励的目标和方法进行具体的研究,采取多方面的激励途径和方法与之相适应,在“以人为本”的员工管理模式基础上建立企业的激励机制。从本中心的激励模式来分析,员工的满意度达不到理想的程度,难以留住人才。 二、激励的基本方式 一般来说,根据需求的不同,可将激励分为四大类;成就激励、能力激励、环境激励和物质激励。 (一)成就激励 近代著名管理学家麦克利兰明确的将人在基本需求(生理一安全)之上的部分分为社会交往——权力欲望——成就欲望等三个不同的层次。在人的需求层次中,成就需要是人的一个相对较多的需求层次。成就激励的基本出发点是随着社会的发展、人们的生活水平逐渐提高,越来越多的人在选择工作时不仅仅是为了生存,更多的是为了获得一种成就感,从实际意义上来说,成就激励是员工激励 一级建造师《建设工程经济》计算公式汇总 1、等额支付系列的终值、现值、资金回收和偿债基金计算 等额支付系列现金流量序列是连续的,且数额相等,即: ) ,,,,常数(n t A A t 321 ①终值计算(即已知A 求F ) i i A F n 11 )( ②现值计算(即已知A 求P ) n n n i i i A i F P )()() ( 1111 ③资金回收计算(已知P 求A ) 111 n n i i i P A )() ( ④偿债基金计算(已知F 求A ) 1 1 n i i F A )( 2、有效利率的计算 包括计息周期有效利率和年有效利率两种情况。 (2)年有效利率,即年实际利率。 年初资金P ,名义利率为r ,一年内计息m 次,则计息周期利率为 m r i 。根据一次支付终值公式可得该年的本利和F ,即: m m r P F 1 根据利息的定义可得该年的利息I 为: 111m m m r P P m r P I 再根据利率的定义可得该年的实际利率,即有效利率i eFF 为: 11i eff m m r P I 3、财务净现值 t c t n t i CO CI FNPV 10 式中 FNPV ——财务净现值; (CI-CO )t ——第t 年的净现金流量(应注意“+”、“-”号); i c ——基准收益率; n ——方案计算期。 4、财务内部收益率(FIRR ——Financial lnternaI Rate oF Return ) 其实质就是使投资方案在计算期内各年净现金流量的现值累计等于零时的折现率。其数学表达式为: t t n t FIRR CO CI FIRR FNPV 10 式中 FIRR ——财务内部收益率。 5、投资收益率指标的计算 是投资方案达到设计生产能力后一个正常生产年份的年净收益总额(不是年销售收入)与方案投资总额(包括建设投资、建设期贷款利息、流动资金等)的比率: %100 I A R 式中 R ——投资收益率; A ——年净收益额或年平均净收益额; I ——总投资 6、总投资收益率 总投资收益率(ROI )表示总投资的盈利水平 %100 TI EBIT ROI 式中 EBIT-----技术方案正常年份的年息税前利润或运营期内平均息税前利润; TI------技术方案总投资包括建设投资、建设期利息和全部流动资金。 7、资本金净利润率(ROE ) 技术方案资本金净利润率(ROE )表示技术方案盈利水平 %100 EC NP ROE 式中 NP----技术方案正常年份的年净利润或运营期内年平均净利润, 净利润=利润总额-所得税 EC----技术方案资本金 8、静态投资回收期 ·当项目建成投产后各年的净收益(即净现金流量)均相同时,静态投资回收期计算: A I P t 式中 I ——总投资; A ——每年的净收益。 ·当项目建成投产后各年的净收益不相同时,静态投资回收期计算: 流量 出现正值年份的净现金的绝对值 上一年累计净现金流量现正值的年份数累计净现金流量开始出 1- t P 9、借款偿还期 余额 盈余当年可用于还款的盈余当年应偿还借款额 的年份数借款偿还开始出现盈余 1-d P 10、利息备付率 利息备付率=息税前利润/计入总成本费用的应付利息。 式中:息税前利润——即利润总额与计入总成本费用的利息费用之和(不含折旧、摊销费 11、偿债备付率 偿债备付率=(息税前利润加折旧和摊销-企业所得税)/应还本付息的金额 式中:应还本付息的资金——包括当期还贷款本金额及计入总成本费用的全部利息; 息税前利润加折旧和摊销-企业所得税=净利润+折旧+摊销+利息 12、总成本 C =C F +C u ×Q C :总成本;C F :固定成本;C u :单位产品变动成本;Q :产销量 量本利模型 思考:如何设计一个组织的激励制度? 什么是激励?美国管理学家贝雷尔森(Berelson)和斯坦尼尔(Steiner)给激励下了如下定义:“一切内心要争取的条件、希望、愿望、动力都构成了对人的激励。——它是人类活动的一种内心状态。”人的一切行动都是由某种动机引起的,动机是一种精神状态,它对人的行动起激发、推动、加强的作用。 如何在工作上调动员工的积极性,激发全体员工的创造力,是开发人力资源的最高层次目标。作为企业,需要塑造激发员工创造力的环境和机制:一是创造一个鼓励员工开拓创新精神和冒险精神的宽松环境以及思想活跃和倡导自由探索的氛围;二是建立正确的评价和激励机制,重奖重用有突出业绩的开拓创新者;三是强化企业内的竞争机制,激励人们去研究新动向、新问题,并明确规定适应时代要求的技术创新和管理创新的具体目标;四是要求企业必须组织员工不断学习以更新知识,并好好的引导他们面对现实去研究技术的新动向。同时做到在员工心里,使他们知道工作行为的实际效果,产生员工高效工作、高满足的结果。 对于激励的方式现在学术界有很多种理论和方法,有著名的马斯洛需求层次理论、激励—保健双因素理论,其中激励因素为满意因素,有了它便会得到满意和激励。保健因素为不满意因素,没有它会产生意见和消极行为。其实诸多模式中都不外乎两个方式:正面激励与反面激励。 对此我们可以从上述两个方面入手建立一个适合、有效的激励模式。 薪酬层面: 企业的人力资源管理系统中,薪酬问题无疑是最为敏感的问题之一。长期以来,分配制度上存在的问题一直困扰着众多企业管理系统运行效率与效果。目前,众多国内企业分配制度上都不同程度地存在两个问题,一是分配中的平均主义,这在国企尤为突出;二是薪资支付的随机性,这是众多民营企业的通病。我在公司实践调查中发现,公司老总总是热衷于绩效管理系统的建设,而不愿意对薪酬系统进行相应的变革。他们的理由很简单:进行薪酬系统变革可能对企业绩效没有直接的影响,况且一旦变革,也许就得加工资,这是多数老板们不情愿看到的,因此也就不会搞这个既发精力又增加人力成本的事。所以在激励员工方面是没有到位的。 从总体管理流程来看,薪酬管理属于企业人力资源管理的一个末端环节,特别是在企业最底层的员工,对于他们这个薪酬的激励作用可以说是整个企业中最大的。前面已提到他们大多是从经济水平低的农村来的,所以物质的满足即是他们工作最重要的目的了。针对员工我们可以采用以下方法建立薪酬机制: 其一是废除官僚的行政级别制度建立以市场为导向的薪酬机制 在薪酬制度上企业一般采用行政级别制,在这种制度下员工的发展是极为单向的,要想多赚钱只有“熬”级别,通过对制造企业的岗位分析,其车间员工占一个相当大的比例,余下的或做技术的员工,或做销售的员工,他们不可能都安排担任行政的级别,在这种现状下,上至高层领导、中至车间领导、下至基层员工,三者继续倚老卖老、抱残守缺、继续维系个人利益、裙带利益和派系利益。要想清除这种不良的现象,必须废除官僚的行政级别制建立以市场为导向的薪酬机制,在这种机制下,薪酬不再以行政级别为标准,而是以员工对企业 精品文档 等本息法和等本金法的两种算公式 一: 按等额本金还款 法:贷款额为: a, 月利率为: i , 年利率为: I , 还款月数: n, an 第 n 个月贷款剩余本金: a1=a, a2=a-a/n, a3=a-2*a/n ...次类推 还款利息总和为Y 每月应还本金: a/n 每月应还利息: an*i 每期还款 a/n +an*i 支付利息 Y=( n+1)*a*i/2 还款总额 =( n+1)*a*i/2+a 等本金法的算等本金(减法):算公式: 每月本金=款÷期数 第一个月的月供 =每月本金+款×月利率 第二个月的月供 =每月本金+(款-已本金)×月利率 申10 万 10 年个人住房商性款,算每月的月供款?(月利率: 4.7925 ‰)算果: 每月本金: 100000÷120= 833 元 第一个月的月供:833+ 100000×4.7925 ‰=1312.3 元 第二个月的月供:833+( 100000- 833)×4.7925 ‰= 1308.3 元 如此推?? 二 : 按等本息款法:款 a,月利率 i ,年利率 I ,款月数n,每月款 b,款利息和 Y 1: I =12×i 2: Y=n×b- a 3:第一月款利息:a×i 第二月款利息:〔a-( b- a×i )〕×i =( a×i -b)×( 1+ i ) ^1 +b 第三月款利息:{ a-( b- a×i )-〔 b-( a×i - b)×( 1+ i ) ^1 -b〕}×i =( a×i -b)×( 1+i ) ^2 + b 第四月款利息:=( a×i - b)×( 1+ i ) ^3 + b 第 n 月款利息:=(a×i - b)×( 1+ i ) ^( n- 1)+ b 求以上和:Y=( a×i -b)×〔( 1+ i ) ^n- 1〕÷i + n×b 4:以上两Y 相等求得 月均款 :b = a×i ×( 1+ i ) ^n ÷〔( 1+ i )^n - 1〕 支付利息 :Y = n×a×i ×( 1+i ) ^n ÷〔( 1+ i ) ^n - 1〕- a 款 :n ×a×i ×( 1+ i )^n ÷〔( 1+ i ) ^n- 1〕 注:a^b 表示 a 的 b 次方。 等本息法的算 ----- 例如下: 如款 21 万, 20 年,月利率 3.465 ‰按照上 面的等本息公式算 月均款 :b = a×i ×( 1+ i ) ^n ÷〔( 1+ i )^n - 1〕即: =1290.11017 即每个月款1290 元。 。 1欢迎下载 建立健全激励机制深化国有企业改革(上) ——四川建立健全国企经营管理者激励机制的探索与启示随着改革的深入,四川省委、省政府进一步认识到:国企要摆脱困境,必须建立起一套符合社会主义市场经济要求的企业制度、管理体制和管理模式。在建立现代企业制度进程中,由于出资者缺位等国情特点,搞活国有企业更有赖于高素质的企业经营管理者,尤其是高素质的职业企业家阶层。而要调动他们的积极性和创造性,必须要有一套适应社会主义市场经济体制要求的激励约束机制。由于四川省委、省政府高度重视,大胆改革,使四川国企经营管理者激励机制的探索建立有较大突破,取得了实质性进展。 一、四川探索国有企业经营管理者激励机制的作法及成效 (一)四川对国企经营管理者的主要激励方式 1、物质激励 四川采取的物质激励形式,归纳起来,主要有六种: (1)业绩计提 报酬结构:基薪+业绩计提 对省属公司制企业的董事长、总经理或非公司制企业的厂长(经理)主要采用这种激励形式,部分市、县也参照这种形式制定国企经营管理者的报酬方案。其基薪主要根据企业规模、本地区和本企业职工平均工资收入水平确定,其公式为: 基薪=(本企业职工上年度平均工资+本地区职工上年度平均工资)÷2×系数 公式中“系数”根据企业资产规模等具体情况,确定在2.0-10.0的范围内。业绩计提以基薪为基础,根据其经营实绩确定。赢利企业、亏损企业的考核指标及计算办法有所区别。赢利企业主要考核指标为净资产增值率、净资产收益率和社会贡献率:净资产增值率每增加1%,按基薪的15%计提业绩收入;净资产收益率每增加1%,按基薪的10%计提业绩收入;社会贡献率每增加1%,按基薪的6%计提业绩收入。亏损企业经营管理者业绩收入主要按减亏增盈指标考核,实行分档递减计提的办法,按减亏额的1-2%计提业绩收入。税收指标是计提业绩收入的否定指标,亏损企业的社会贡献率指标也是计提业绩收入的否定指标。各项考核指标基数原则上以上年实际完成数为基础并参考行业和区域内经济效益水平合理确定,考核指标基数一年一定。同时建立国企经营管理者专用帐户,将其业绩收入的50%存入专户,作为经营管理者任期风险保证金,用于抵补经营管理者以后年度可能形成的亏损。经营管理者调动、解聘或退休时,经离任审计一年后,方能兑现余额。 (2)奖售股权 报酬结构:基薪+股权或股票期权等 对股份制企业,尤其是上市公司的总经理或董事长采用这种激励形式,其他领导班子成员按照小于1的系数进行折算,通过给予不同数量的股权、股票期权来体现其差别。奖售股权分四种情况:一是奖励股。有些市专门设了两种形式的奖励股份:一种是将经营管理者年薪中的部分奖金折算成普通股份;另一种是凡任期内经济效益连续3年上升及做出其他突出贡献的,按企业净资产的含量折算为股份予以奖励。二是出资购买和送配股。长虹集团改制时,要求经营管理人员购买股份,根据职位和工龄,最多8000多股,最少3000多股。其中董事长兼总经理期初持股7900股,逐年送配后现在达65227股。在任期间,这些股票均被“锁定”,不能出售。三是岗位股。南充、眉山等地在国企股份制改造时,对总经理设岗位股,经理班子其他成员按经理的0.5-0.8比例设置。这种岗位股实际上是一种干股,只享有红利分配权。四是股票期权和分配权期权,目前四川正在积极探索试行这种激励方式。 (3)目标定酬 报酬结构:A目标薪金+B目标薪金等 这种形式没有基薪。对国有宾馆、饭店、旅游公司以及部分商贸企业,尤其是特殊困难亟待解决的企业总经理或兼职董事长一般采用这种激励形式。1999年,绵阳药业集团外聘一位营销部经理,年薪28万元(没有基薪),交30万元股金并作为风险抵押金,确定销售、利润两项目标:完成销售目标任务3200万元,领取销售部分底薪8万元;完成利润目标400万元,领取利润部分底薪20万元。实现销售的超差部分则按同比例增减销售底薪(增加销售薪金的前提是必须完成利润指标)。利润指标完成额未达到400万元,则按比例扣减利润底薪,利润低于274万元,则按未完成额的26.8%扣减收入和风险金;利润超出400万元的部分则按所得税后剩余部分的40%提成,年总收入的25%留在公司作为本人风险抵押金。目标定酬的激励约束作用很大,1-9月,该营销部实现利润470万元,是上年同期利润的8倍,净资产收益率已达71.2%。 (4)准公务员报酬 报酬结构:工资+津贴、奖金等 对承担政策目标的水、电、气、电信、邮政及对国民经济和国家安全具有特殊战略意义的大型集团 虚拟演播室技术说明 由于虚拟演播室系统不同于传统演播室的抠像,它允许几台摄象机在不同的角度分做推、拉、摇、移等动作。为了保证摄象机在蓝箱中拍摄的人物与计算机制作的虚拟场景通过色键组合成系统准确合成,要求虚拟演播室系统中人物的活动空间(蓝箱)要有非常均匀和柔和的照明,不能有硬的影子出现,所以首先应用柔光灯把蓝箱铺满打匀,形成一个基本光。 根据贵台的实际情况,设计方案如下: 1.篮箱立面墙的布光:在灯具的选择上,虽然近年来国内一些灯 光企业相继推出了虚拟演播室专用灯光设备,但是由于大多数 电视台虚拟演播室是在原有传统演播室中设置的,所以虚拟演 播室的布光可利用传统演播室的灯具进行布光。布光时,我们 首先考虑选用冷光源——4×55W三基色柔光灯9台,由于它是 散射型光源,布光面积大,容易将墙体的光布匀。 2.篮箱地面布光:在虚拟演播室节目制作时,画面如果出人物的 全景,出现虚拟的地面时,这时不但主持人身后和两侧的蓝墙 要有均匀的布光,而且蓝箱的地面也要有非常均匀的照明。本 方案我们采用4×55W三基色柔光灯6台,作为地面布光,使 篮箱地面光线均匀; 3.人物布光:虚拟演播室人物的布光基本方法和对光比的要求, 仍采用传统演播室的三点式布光和对光比的要求,但同时要考 虑到虚拟演播室的特点。灯光人员在布光前要使人物的主光方 向与虚拟场景中的主光方向一致,同时使光的强弱、硬柔、色彩也都要与虚拟场景中的主光方向一致。使人和景在画面上融为一体,看起来真实。方案采用冷热光源混合式布光,用2台6×55W三基色柔光灯作为侧光,4×55W、6×55W三基色柔光灯各2台,1KW透射式聚光灯2台,作为人物的主面光和辅助面光,使拍摄人物更加丰满圆润; 4.吊挂系统采用格珊架式悬挂,充分利用室内空间高度,避免拍 摄全景时发生“穿帮”现象; 5.整个虚拟演播室采用冷热混合光源布光,总功率为9KW、色温 3200k、中心照度900Lux,满足贵台的虚拟演播室拍摄需求。 工程经济公式总结 1.资金的时间价值计算 2.投资回收期 有现金流量表: 无现金流量表: 3.差额投资回收期 产量相同时: 产量不同时: Q 为产量 4.净现值法: 净现值(NPV)就是将技术方案的整个分析期内不同时点上的净现金流量按基准收益率折算到基准年的现值之和。 计算公式为: 项目分析期内年净现金流量相等 Kp-投资现值 Bt-年等额收益 Ct-年等额支出 L-残值 in-基准收益率 n-寿命 项目分析期内每年净现金流量不等: Ft-t 年的净现金流量 t-现金流量发生年份 5.内部收益率法 202 ' 101'1 01 2 02Q C Q C Q K Q K P a - - = 内部收益率又称内部报酬率,是指方案的净现值等于零时的收益率。即 6.年值法(AW):用于项目的收和支出皆为已知,在进行方案比较时,分别计算各比较方案净效益的等额年值,然 后进行比较,以年值较大的方案为优。 公式为: AW=NPV(A/P,i,n) 其中NPV是净现值,(A/P, i,n)是资本回收系数。 7.年费用比较法(AC法):和年值法相似,用于技术方案的逐年收益无法或无需核算时,以计算各方案所耗费 用来进行比较,并以费用最小的方案作为选优的标准。年费用比较法就是将各技术方案寿命周期内的总费用换算成等额年费用值(年值),并以等额年费用最小的方案作为最优方案。 Act=Ko(A/P,i,n)-KL(A/F,I,n)+c’ Act-年费用 Ko-投资额 KL-残值 c’-等额年费用 8.盈亏平衡分析法 基本公式:B=R-C=P*Q-(F+V*Q+T*Q) F——固定成本V——单位变动成本P——产品单价 Q——产品销售量 B——利润 R——总营业收入 C——总成本收入 T——单位产品营业税金及附加 则年产量的盈亏平衡点为:BEP Q=F/(P-V-T) 营业收入的盈亏平衡点为:BEP R=P*F/(P-V-T) 盈亏平衡点的生产能力利用率为:BEP Y=BEP Q/Q=F/{(P-V-T)*Q} (<75﹪) 9.决策树法: (1) 画决策树。决策点用方框表示,机会点用圆圈表示。概率枝末稍用Δ表示。(2) 计算各机会点的期望值。计算时从右向左逆向进行。 (3) 修枝选优,作出决策。 重点计算期望值,期望值=∑各状态枝的损益值*其出现概率 10.FD法(强制确定)计算价值系数 第一步计算功能评价系数=功能得分/总得分 第二步计算功能成本系数=功能成本/总成本 第三步计算功能价值系数=功能评价系数/成本系数 第四步计算目标成本=总目标成本*功能评价系数 第五比虚拟演播室方案
等额本息和等额本金计算公式
促销活动中激励机制如何设置
建设工程经济公式汇总
虚拟演播室系统方案
房贷等额本息还款公式推导(详细)
员工激励机制全套方案设计
建设工程经济计算公式汇总
如何设计一个组织的激励制度
等额本息法及等额本金法两种计算公式.doc
建立健全激励机制
虚拟演播室灯光技术说明
2014工程经济公式总结
相关主题
文本预览