SCIENCE AND TECHNOLOGY RESEARCH AND DEVELOPMENT (R&D)
EXPENDITURE ON R&D
INVESTMENT IN KNOWLEDGE
RESEARCHERS
PATENTS
ICT
SIZE OF THE ICT SECTOR
INVESTMENT IN ICT COMPUTER AND INTERNET ACCESS BY HOUSEHOLDS
COMMUNICATIONS EXPORTS OF INFORMATION AND COMMUNICATIONS EQUIPMENT
TELEPHONE ACCESS
Source
? OECD (2005), Main Science and Technology Indicators , OECD, Paris.
Futher information
Analytical publications
? OECD (2005), OECD Science, Technology and Industry Scoreboard , OECD, Paris.
Statistical publications
? OECD (2005), OECD Science, Technology and R&D Statistics on CD-ROM , OECD, Paris.
Methodological publications
? OECD (2003), Frascati Manual 2002: Proposed Standard Practice for Surveys on Research and Experimental Development , OECD, Paris.
Online databases
? STAN: OECD Structural Analysis Statistics – online database , ANBERD: R&D Expenditure in Industry.
Web sites
? OECD Science, Technology and Industry, https://www.doczj.com/doc/169250169.html,/sti .
Long-term trends
Since 2000, R&D expenditure relative to GDP (R&D intensity) has increased in Japan and, to a lesser
extent, in the EU, and it has decreased slightly in the United States.
In 2003, Sweden, Finland, and Japan were the only three OECD countries in which the R&D-to-GDP ratio exceeded 3%, well above the OECD average of 2.3%. Since the mid-1990s, R&D expenditure (in real terms) has been growing the fastest in Iceland, T urkey and Portugal, all of which had average annual growth rates above 10%.
R&D expenditure for China has been growing even faster than GDP , resulting in a rapidly increasing R&D intensity, growing from 1.0% in 2000 to 1.4% in 2004.
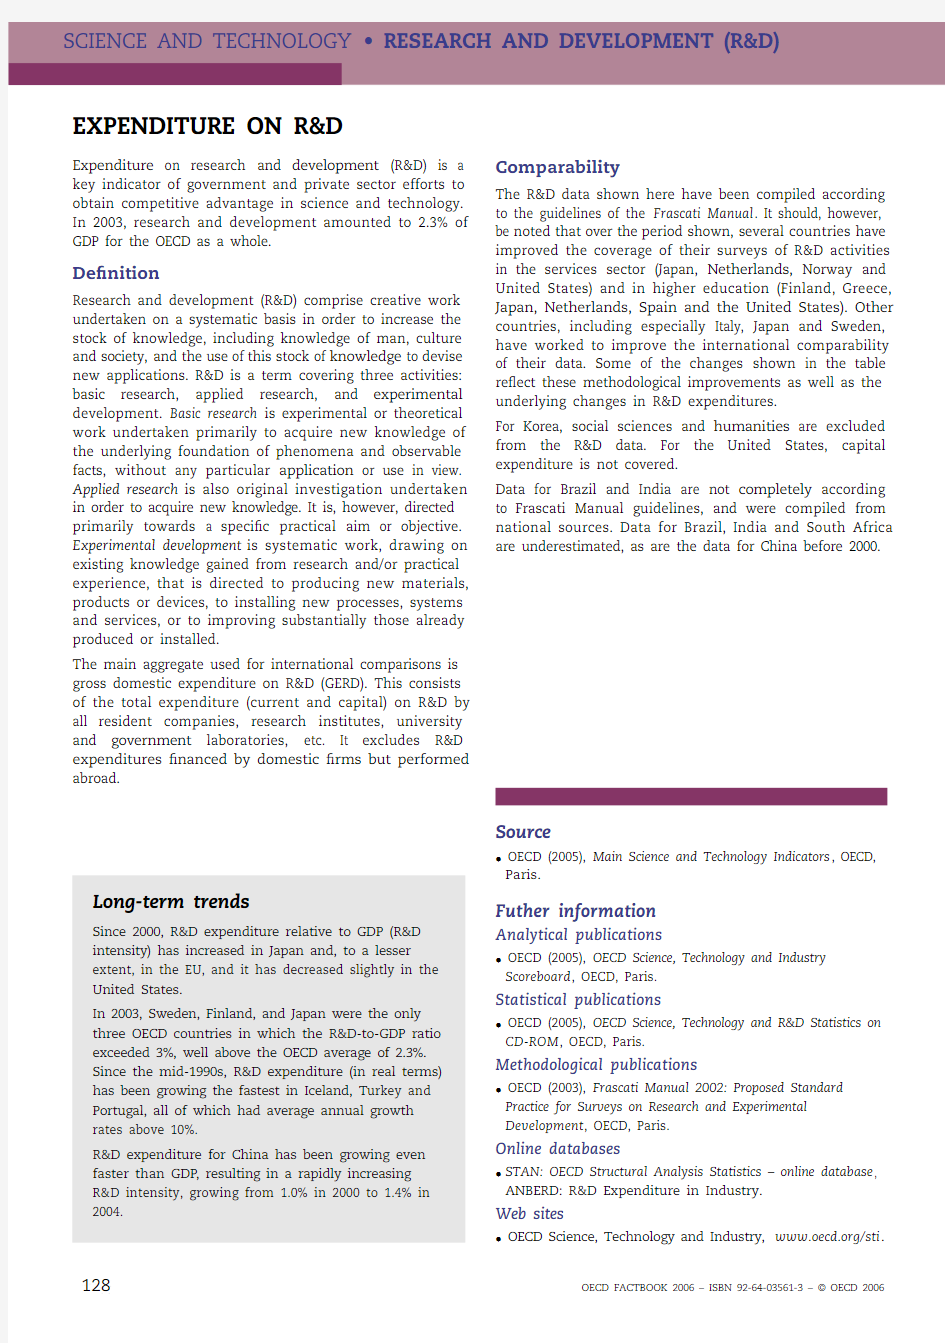
EXPENDITURE ON R&D
Expenditure on research and development (R&D) is a key indicator of government and private sector efforts to obtain competitive advantage in science and technology. In 2003, research and development amounted to 2.3% of GDP for the OECD as a whole.
De?nition
Research and development (R&D) comprise creative work undertaken on a systematic basis in order to increase the stock of knowledge, including knowledge of man, culture and society, and the use of this stock of knowledge to devise new applications. R&D is a term covering three activities: basic research, applied research, and experimental development. Basic research is experimental or theoretical work undertaken primarily to acquire new knowledge of the underlying foundation of phenomena and observable facts, without any particular application or use in view. Applied research is also original investigation undertaken in order to acquire new knowledge. It is, however, directed primarily towards a speci?c practical aim or objective. Experimental development is systematic work, drawing on existing knowledge gained from research and/or practical experience, that is directed to producing new materials, products or devices, to installing new processes, systems and services, or to improving substantially those already produced or installed.
The main aggregate used for international comparisons is gross domestic expenditure on R&D (GERD). This consists of the total expenditure (current and capital) on R&D by all resident companies, research institutes, university and government laboratories, etc. It excludes R&D expenditures ?nanced by domestic ?rms but performed abroad.
Comparability
The R&D data shown here have been compiled according to the guidelines of the Frascati Manual . It should, however, be noted that over the period shown, several countries have improved the coverage of their surveys of R&D activities in the services sector (Japan, Netherlands, Norway and United States) and in higher education (Finland, Greece, Japan, Netherlands, Spain and the United States). Other countries, including especially Italy, Japan and Sweden, have worked to improve the international comparability of their data. Some of the changes shown in the table re?ect these methodological improvements as well as the underlying changes in R&D expenditures.
For Korea, social sciences and humanities are excluded from the R&D data. For the United States, capital expenditure is not covered.
Data for Brazil and India are not completely according to Frascati Manual guidelines, and were compiled from national sources. Data for Brazil, India and South Africa are underestimated, as are the data for China before 2000.
SCIENCE AND TECHNOLOGY ? RESEARCH AND DEVELOPMENT (R&D)
SCIENCE AND TECHNOLOGY ? RESEARCH AND DEVELOPMENT (R&D)
EXPENDITURE ON R&D
Gross domestic expenditure on R&D
As a percentage of GDP
1991
19921993
19941995
19961997
19981999
20002001
20022003
2004
Belgium 1.62.. 1.70 1.69 1.72 1.80 1.87 1.90 1.96 2.00 2.11 1.96 1.89..Canada 1.60 1.64 1.70 1.76 1.72
1.68 1.68 1.79 1.82 1.93
2.08 1.97 1.95 1.93Czech Republic 1.90 1.62 1.14 1.030.950.98 1.09 1.17 1.16 1.23 1.22 1.22 1.26 1.28Denmark 1.61 1.64 1.72.. 1.82 1.84 1.92 2.04 2.18.. 2.39 2.53 2.62..Finland 2.02 2.11 2.14 2.26 2.26 2.52 2.69 2.86
3.21 3.38 3.38 3.43 3.48..France 2.33 2.33 2.37 2.32 2.29 2.27 2.19 2.14 2.16 2.15 2.20 2.23 2.18 2.16Germany 2.47 2.35 2.28 2.18 2.19 2.19 2.24 2.27 2.40 2.45 2.46 2.49 2.52 2.49Greece 0.36..0.47..0.49..0.51..0.67..0.65..0.62..Hungary 1.06 1.040.970.880.730.650.720.680.690.800.95 1.020.950.88Iceland 1.18 1.36 1.37 1.41 1.58.. 1.89 2.08 2.39 2.76 3.08 3.14 2.97..Ireland 0.93 1.04 1.17 1.27 1.28 1.32 1.29 1.25 1.19 1.14 1.11 1.12 1.19 1.21Italy 1.23 1.18 1.13 1.05 1.00 1.01 1.05 1.07 1.04 1.07 1.11 1.16....Japan 2.76 2.71 2.63 2.58 2.69 2.78 2.84 2.95 2.96 2.99 3.07 3.12 3.15..Korea 1.84 1.94 2.12 2.32 2.37 2.42 2.48 2.34 2.25 2.39 2.59 2.53 2.63..Luxembourg .................. 1.71.... 1.78..Mexico https://www.doczj.com/doc/169250169.html,herlands 1.97 1.90 1.93 1.97 1.99 2.01 2.04 1.94 2.02 1.90 1.88 1.80 1.8
4..New Zealand 0.98 1.00 1.01..0.96.. 1.10.. 1.01.. 1.1
5.. 1.1
6..Norway 1.64.. 1.72.. 1.70.. 1.64.. 1.65.. 1.60 1.67 1.75..Poland 0.760.780.780.710.650.670.670.680.700.660.640.580.56..Portugal 0.570.610.610.590.570.600.620.690.750.800.850.800.78..Slovak Republic 2.13 1.78 1.380.900.930.92 1.090.790.660.650.640.580.580.53Spain 0.810.850.850.790.790.800.790.870.860.910.920.99 1.05..Sweden 2.72.. 3.1
7.. 3.35.. 3.54.. 3.65.. 4.29.. 3.9
8..Switzerland .. 2.5
9...... 2.67...... 2.57........Turkey 0.530.490.440.360.380.450.490.500.630.640.720.66....United Kingdom 2.07 2.03 2.06 2.01 1.95 1.88 1.81 1.80 1.87 1.86 1.87 1.89 1.88..United States 2.71 2.64 2.52 2.42 2.51 2.55 2.58 2.62 2.66 2.74 2.76 2.65 2.68 2.68EU15 1.87 1.85 1.84 1.80 1.78 1.78 1.78 1.79 1.84 1.87 1.90 1.91 1.91..India
..............0.610.670.720.78......Russian Federation 1.430.740.770.840.850.97 1.040.95 1.00 1.05 1.18 1.25 1.29 1.17South Africa
0.84
..
0.61
..
..
..
0.60
..
..
..
0.73
..
..
..
1
2
3
4
5
M e x i c o S l
o v
a k R e p u
b l i
c P o l a n
d G r
e e c e T u r k e y S o u t h A
f r i c a I n d i a P o r t u
g a l H u n g a r y B r a z i l S p a i n I t a l y N e w Z e a l a n d R u s s i a n F e d e r a t i o n I r e l a n d C z e c
h R e p u b l
i c C h i n a A u s t r a l i a N o r w a y L u x e m b o u r g N e t h e r l a n d s U n i t e d K i n g d o m B e l g i u m E U 15C a n a d a F r a n c e A u s t r i a O E C D t o t a l G e r m a n y S w i t z e r l a n d D e n m a r k K o r e a U n i t e d S t a t e s I c e l a n d J a p a n F i n l a n d S w e d e n
StatLink: https://www.doczj.com/doc/169250169.html,/10.1787/126522165854
StatLink: https://www.doczj.com/doc/169250169.html,/10.1787/315080082477
Gross domestic expenditure on R&D
As a percentage of GDP , 2004 or latest available year
Source
? OECD (2005), OECD Science, Technology and Industry Scoreboard , OECD, Paris.
Futher information
Analytical publications
? Ahmad, N. (2003), Measuring Investment in Software , OECD Science, Technology and Industry Working Papers, No. 2003/6, OECD, Paris.
Statistical publications
? OECD (2005), Main Science and Technology Indicators , OECD, Paris.
? OECD (2005), OECD Science, Technology and R&D Statistics on CD-ROM , OECD, Paris.
Methodological publications
? Kahn, M. (2001), “Investment in Knowledge”, STI Review No. 27, OECD, Paris.
? Kahn, M. (2005), “Estimating the level of Investment in Knowledge across OECD countries”, Intellectual Capital for Community – Nations, Regions, and Cities edited by Ahmed Bounfor and Leif Edvinsson , Elsevier Butterworth-Heinemann, Amsterdam; Boston.
Web sites
? OECD Measuring Science and Technology, https://www.doczj.com/doc/169250169.html,/sti/measuring-scitech .
? OECD Science, Technology and Industry Scoreboard, https://www.doczj.com/doc/169250169.html,/scoreboard .
Long-term trends
The United States and Japan are moving more
rapidly towards a knowledge-based economy than the EU: since 1994, their investment in knowledge-to-GDP ratios have grown at a higher rate than that of the EU. For all the countries, except Ireland, the ratio of investment in knowledge-to-GDP was higher in 2002 than in 1994.
For most countries, increases in software
expenditure were the major source of increased investment in knowledge. Notable exceptions are Finland (where R&D was the main source of increase) and Greece (where higher education and software were the main sources of increase). In 2002, investment in knowledge amounted to 5.2% of GDP in the OECD area, a share that has increased over time. In 2002, the United States invested 6.6% of GDP in knowledge, Japan 5.0% and the European Union 3.8%. Like the United States, Sweden and Finland also invested more than 6% of GDP in
knowledge in 2002, while less than 2% of GDP was invested in knowledge in Portugal and Greece.
INVESTMENT IN KNOWLEDGE
“Investment in knowledge” is a synthetic indicator designed to compare member countries’ expenditures on their “knowledge base” which are aimed at bringing future returns.
De?nition
Investment in knowledge is de?ned and calculated as the sum of expenditure on R&D, on total higher education (public and private) and on software. Simple summation of the three components would lead to overestimation of the investment in knowledge owing to overlaps (R&D and software, R&D and education, software and education). Therefore, data reported here have been adjusted to exclude the overlaps between components.
Note that as the term is used here, “investment” has a broader connotation than its usual meaning in economic statistics. It includes current expenditures, such as on education and R&D, as well as capital outlays, such as purchases of software and construction of school buildings.
Comparability
The OECD is the source of the data on R&D, education and software. In previous years, the software component of investment in knowledge was estimated from a private source. However, the OECD has recently developed a capital services database, which includes software investment data. Software data from the OECD’s capital services database are used here, and the ?gures reported here differ from those of previous years.
SCIENCE AND TECHNOLOGY ? RESEARCH AND DEVELOPMENT (R&D)
Investment in knowledge for selected countries
As a percentage of GDP
1994
19951996199719981999200020012002
34
5
6
7
8
StatLink: https://www.doczj.com/doc/169250169.html,/10.1787/573252125823
SCIENCE AND TECHNOLOGY ? RESEARCH AND DEVELOPMENT (R&D)
INVESTMENT IN KNOWLEDGE
Investment in knowledge
As a percentage of GDP
1994
19951996199719981999200020012002
Belgium .......... 3.6 3.7 3.9 3.8Canada 4.5 4.4 4.2 4.0 4.1 4.7 4.7 5.0 4.7Denmark 3.7 3.9 3.9
4.0 4.7 4.9
5.0 5.3 5.5Finland 4.7 5.0 4.8 5.4 5.5 5.7 5.9
6.0 6.1France 3.4 3.5 3.5 3.5 3.5 3.6 3.6 3.7 3.7Germany 3.4 3.4 3.5 3.6 3.6 3.8 3.8 3.9 3.9Greece 1.1 1.1 1.2 1.7 1.8 1.7 1.6 1.9..Ireland 2.6 2.5 2.7 2.5 2.5 2.5 2.6 2.5 2.4Italy 2.0 2.0 2.1 2.1 2.1 2.2 2.3 2.4..Japan 3.9 3.9 4.1 4.2 4.5 4.7 4.7 4.9 5.0Korea .. 4.9 5.2 5.4 5.5 5.3 5.8 6.1 5.9Netherlands 3.4 3.3 3.6 3.6 3.7 4.0 3.9 4.0 3.8New Zealand ................ 2.8Portugal 1.3 1.4 1.5 1.6 1.7 1.8 1.8 1.9 1.8Spain 2.1 2.1 2.3 2.3 2.4 2.5 2.7 2.7 2.8Sweden 5.1 5.3 5.5 5.7 6.0 6.4 6.9
7.1 6.8United Kingdom 3.5 3.6 3.6 3.4 3.7 3.7 3.6 3.6 3.7United States
5.4
5.6
5.9
6.2
6.1
6.4
7.0
6.9
6.6
02
4
6
8
P o r t u g a
G r
e e c
e
I t a
l y
I r e
l a n d N e w Z
e a
l a n d
S p
a i n
A u s t r i
a
U
n i t
e d
K i n g
d o m
F r
a n c
e N e
t h e
r l a
n d s
E U
15B
e l g
i u m G e
r m
a n
y A u
s t
r a l i a C
a n
a d a
J a
p a n O E
C D
t o t a
D e n m
a r
k
K o
r e a
F i n
l a n d
U n
i t e
d S t a t e
s S
w e
d
e n
StatLink: https://www.doczj.com/doc/169250169.html,/10.1787/213340280004
StatLink: https://www.doczj.com/doc/169250169.html,/10.1787/554030183064
Investment in knowledge
As a percentage of GDP , 2002 or latest available year
Source
? OECD (2005), Main Science and Technology Indicators , OECD, Paris.
Futher information
Analytical publications
? OECD (2005), OECD Science, Technology and Industry Scoreboard , OECD, Paris.
Statistical publications
? OECD (2005), OECD Science, Technology and R&D Statistics on CD-ROM , OECD, Paris.
Methodological publications
? OECD (2003), Frascati Manual 2002: Proposed Standard Practice for Surveys on Research and Experimental Development , OECD, Paris.
Web sites
? OECD Measuring Science and Technology, https://www.doczj.com/doc/169250169.html,/sti/measuring-scitech .
? OECD Science, Technology and Industry, https://www.doczj.com/doc/169250169.html,/sti .? OECD Science, Technology and Industry Scoreboard, https://www.doczj.com/doc/169250169.html,/scoreboard .
Long-term trends
In 2002, there were about 8.3 researchers per
thousand employees in the OECD area, compared with 5.7 per thousand in 1991. The number of
researchers has steadily increased over the last two decades. Among the major OECD regions, Japan has the highest number of researchers relative to total employment, followed by the United States and the European Union.
Finland, Japan, New Zealand and Sweden have the highest number of research workers per thousand persons employed. Rates are also high in the United States, Denmark, France and Australia. Research workers per thousand employees are low in the Czech Republic, Hungary and Portugal.
Among the major non-member countries, growth has been steady in China, although, at 1.2 in 2004, it still remains well below the OECD average. The rate for the Russian Federation has been falling since 1994, but was still above 7 researchers per thousand employed in 2004.
RESEARCHERS
Researchers are the central element of the research and development system. In 2002, approximately 3.6 million persons in the OECD area were employed in research and development and approximately two-thirds of these were engaged in the business sector.
De?nition
Researchers are de?ned as professionals engaged in the conception and creation of new knowledge, products, processes, methods and systems as well as those who are directly involved in the management of projects. They include researchers working in both civil and military research in government, universities, research institutes as well as in the business sector.
Comparability
The number of researchers is expressed in full-time equivalent (FTE) on R&D (i.e. a person working half-time on R&D is counted as 0.5 person-year) and includes staff engaged in R&D during the course of one year. The data have been compiled on the basis of the methodology of the Frascati Manual, but comparability over time is affected to some extent by improvements in the coverage of national R&D surveys and efforts by countries to improve the international comparability of their data.
For the United States, the total researchers ?gure for 2000-2002 is an OECD estimate, and data since 1985 exclude military personnel.
Data for Brazil and India are not completely according to Frascati Manual guidelines, and were compiled from national sources. Data for Brazil, India and South Africa are underestimated, as are the data for China before 2000.
SCIENCE AND TECHNOLOGY ? RESEARCH AND DEVELOPMENT (R&D)
SCIENCE AND TECHNOLOGY ? RESEARCH AND DEVELOPMENT (R&D)
RESEARCHERS
Researchers
Per thousand employed, full-time equivalent
1991
1992199319941995199619971998199920002001200220032004
Belgium 4.7.. 5.5 5.9 6.1 6.5 6.87.07.47.57.8......Canada 5.1 5.5 5.7 6.4 6.4 6.6 6.6 6.6 6.77.2
7.57.2....Czech Republic ........ 2.3 2.5 2.4 2.5 2.8 2.9 3.1 3.1 3.3 3.5Denmark 4.6 5.0 5.3.. 6.1 6.3 6.5.. 6.9..7.09.29.3..Finland 6.0..7.4..8.2..12.313.914.515.115.816.417.7..France 5.7 6.2 6.5 6.6 6.7 6.8 6.8 6.7 6.87.17.27.57.8..Germany 6.3...... 6.2 6.1 6.3 6.3 6.6 6.6 6.7 6.87.0..Greece 1.7.. 2.2.. 2.5.. 2.9.. 3.7.. 3.7......Hungary 3.2 3.0 3.1 3.1 2.9 2.9 3.1 3.2 3.3 3.8 3.8 3.9 3.9 3.8Ireland 4.4 4.8 4.1 4.3 4.5 4.8 5.0 5.1 4.9 5.0 5.1 5.3 5.5 5.8Italy 3.3 3.3 3.3 3.4 3.4 3.5 3.0 2.9 2.9 2.9 2.8 3.0....Japan 7.57.77.98.18.39.29.29.79.99.710.29.910.4..Korea ........ 4.9 4.8 4.8 4.7 4.9 5.1 6.3 6.4 6.8..Luxembourg .................. 6.2.... 6.6..Mexico https://www.doczj.com/doc/169250169.html,herlands .... 4.6 4.9 4.9 4.9 5.0 5.1 5.1 5.2 5.5 5.2....New Zealand 4.0 5.1 5.3.. 4.7.. 6.2.. 6.2..9.1..10.2..Norway 6.6..7.2..7.5..7.9..8.0..8.7..9.1..Poland ...... 3.0 3.2 3.3 3.4 3.4 3.6 3.5 3.7 3.8 4.5..Portugal 1.9 2.1 2.2 2.3 2.6 2.8 3.0 3.1 3.3 3.4 3.5 3.8 4.0..Slovak Republic ...... 4.9 4.6 4.6 4.7 4.8 4.5 4.9 4.7 4.5 4.7 5.2Spain 2.8 2.9 3.1 3.5 3.4 3.6 3.7 3.9 3.9 4.7 4.7 4.8 5.2..Sweden 5.9..7.2..8.2..9.2..9.6..10.6..11.0..Switzerland .. 4.4...... 5.6...... 6.3........Turkey 0.60.70.70.70.80.90.90.90.9 1.1 1.1 1.1....United Kingdom 4.6 4.7 4.8 4.9 5.3 5.2 5.1 5.5............United States 8.1..8.2..8.1..8.8..9.39.39.59.6....China 0.70.70.70.80.80.80.80.70.7 1.0 1.0 1.1 1.2 1.2India
..............0.3............Russian Federation ......9.19.28.58.27.77.87.87.87.57.47.1South Africa
..
..
..
..
..
..
..
..
..
..
1.3
..
..
..
3
6
9
12
15
18
M
e x i c o B r a z i l T u r k e y C h i n a S o u t h A
f r i c a I t a l y C z e c h R e p u b l i c G r e e c e H u n
g a r y P o r t u g a l P o l a n d S p a i n S l o v a k R e p u b l i c N e t
h e r l a n d s U n
i t e d K i n g d o m A u s t r i a I r e l a n d E U 15S w i t z e r l a n d L u x e m b o u r g K o r e a G e r m a n y C a n a d a R u s s i a n F e d e r a t i o n F r a n c e B e l g i u m A u s t r a l i a O E C D t o t a l N o r w a y D e n m a r k U n i t e d S t a t e s N e w Z e a l a n d J a p a n S w e d e n F i n l a n d
StatLink: https://www.doczj.com/doc/169250169.html,/10.1787/518217632074
StatLink: https://www.doczj.com/doc/169250169.html,/10.1787/645704204605
Researchers
Per thousand employed, full-time equivalent, 2004 or latest available year
Source
? OECD (2005), OECD Science, Technology and Industry Scoreboard , OECD, Paris.
Futher information
Analytical publications
? Dernis, H., D. Guellec and B. van Pottelsberghe (2001), “Using Patent Counts for Cross-country Comparisons of Technology Output”, STI Review No. 27, OECD, Paris.? Johnson, D. (2002), The OECD Technology Concordance (OTC): Patents by Industry of Manufacture and Sector of Use , OECD Science, Technology and Industry Working Papers, No. 2002/5, OECD, Paris.
? Lichtenberg, F . and S. Virabhak (2002), Using Patents Data to Map Technical Change in Health-Related Areas , OECD Science, Technology and Industry Working Papers, No. 2002/16, OECD, Paris.
Methodological publications
? Dernis, H. and M. Khan (2004), Triadic Patent Families Methodology , OECD Science, Technology and Industry Working Papers, No. 2004/2, OECD, Paris.
Online databases
? OECD Patent Database .
Web sites
? OECD Intellectual Property Rights, https://www.doczj.com/doc/169250169.html,/sti/ipr .? OECD Work on Patents, https://www.doczj.com/doc/169250169.html,/sti/ipr-statistics .
Long-term trends
In 2002, there were 50 494 patent families in the OECD area, a 55% increase from 1990. The United States accounted for 36% of the OECD total, followed by the European Union (32%) and Japan (26%). Over the 1990s, the European Union’s share of patent
families converged towards that of the United States, while that of Japan declined.
The graph shows patent families per million
population. Sweden, Japan, Finland and Switzerland had the highest propensities to patent among OECD countries.
In 2002, Switzerland had 126 patent families per million population and Finland had 114. Japan (104) and Sweden (100) also had a high propensity to patent. In contrast, China, T urkey and Mexico had low propensities to patent.
The numbers of triadic patent families are still insigni?cant for the ?ve non-member countries shown in the table, although the numbers are growing quite rapidly in China and, to a lesser extent, in India.
PATENTS
Patent-based indicators provide a measure of the output of a country’s R&D, i.e. its inventions. However, the methodology used can in?uence the results. Simple counts of patents ?led at an intellectual property of?ce are affected by various kinds of bias, such as weaknesses in international comparability (home advantage for patent applications) and highly heterogeneous patent values. The OECD has developed a patents indicator using what are here called triadic patent families . This indicator is designed to capture all important inventions and to be internationally comparable.
De?nition
A patent family is de?ned as a set of patents taken in various countries (i.e. patent of?ces) to protect the same invention. Triadic patent families are a set of patents taken at all three of these major patent of?ces – the European Patent Of?ce (EPO), the Japanese Patent Of?ce (JPO) and the United States Patent and Trademark Of?ce (USPTO). Triadic patent family counts are attributed to the country where the patent is ?rst registered.
Comparability
The concept of triadic patent families has been developed in order to improve the international comparability and quality of patent-based indicators.
SCIENCE AND TECHNOLOGY ? RESEARCH AND DEVELOPMENT (R&D)
Share of countries in triadic patent families
Percentage, Year 2002
StatLink: https://www.doczj.com/doc/169250169.html,/10.1787/677743873822
SCIENCE AND TECHNOLOGY ? RESEARCH AND DEVELOPMENT (R&D)
PATENTS
Number of triadic patent families
1990
199119921993199419951996199719981999200020012002
Belgium 224240295329348372352415403416436424397Canada 289274271297357384432525546603640670661
Czech Republic 79775310101411111212Denmark 127106135160176189220209225228246228216Finland 150162225243340312353441442482524579594France 1919178416511697187419072121216723102380245424512447Germany 4115
3681
3874
4001
4361
4823
546455626097
6361
7156
7302
7271
Greece 456341131084657Hungary 30221923202525321835322827Iceland 1301367457878Ireland 27272319283029343356585860Italy 646663579629622610688724790792821848840Japan 99408894819684958263948710490110251125711844123551293713195Korea 6593121167213327325386466501532593630Luxembourg 17991471315162020192221Mexico 76665129121211141515Netherlands 591569614594649727787810846874918931966New Zealand 9192613232032394435394041Norway 525973718087769293100106100106Poland 5951245109471099Portugal 1344233744886Slovak Republic 001112143353..Spain 73706573858887107121117119121120Sweden 43239151750063170179584899410531033967896Switzerland 788723716708713748798805856913949951924Turkey 1002222374679United Kingdom 1454125413061363146515201608158015961955207820932045United States 11171102371061010520110951210012921140081291516353175341821318324EU159950913994499804108011151712750131811415615014161541631316167China 1212161718202243447592133144India
1295861115233132526978Russian Federation 21384533526258658874846559South Africa 13173233202629323533383838World
32753
29964
30020
30675
32189
35388
38655
41035
41419
46614
49698
51263
51502
20
40
60
80
100
120
125.8
C h i n a T u r k e y M e x i c o P o l a n d R u
s s i a n F e d e r a t i o n P o r t u g a l
G r e e c e S o u t h A f r i c a C z e c h R e p u b l i c H u n g a r y S p a i n N e w Z e a l a n d K o r e a I t a l y I r e l a n d A u s t r a l i a C a n a d a N o r w a y I c e l a n d U n i t e d K i n g d o m A u s t r i a B e l g i u m F r a n c e D e n m a r k L u x e m b o u r g O E C D t o t a l N e t h e r l a n d s U n i t e d S t a t e s G e r m a n y S w e d e n J a p a n F i n l a n d S w i t z e r l a n d
StatLink: https://www.doczj.com/doc/169250169.html,/10.1787/554240111303StatLink: https://www.doczj.com/doc/169250169.html,/10.1787/326527586012
Number of triadic patent families
Per million population, 2002
Source
? OECD (2005), OECD Science, Technology and Industry Scoreboard , OECD, Paris.
Futher information
Analytical publications
? OECD (2003), ICT and Economic Growth: Evidence from OECD countries, industries and ?rms , OECD, Paris.
? OECD (2005), Guide to Measuring the Information Society , OECD, Paris.
? OECD (2005), OECD Communications Outlook , OECD, Paris.? OECD (2005), OECD Information Technology Outlook , OECD, Paris.
Statistical publications
? OECD (2004), Understanding Economic Growth A Macro-level, Industry-level, and Firm-level Perspective , OECD, Paris.
Online databases
? Telecommunications Database .
Web sites
? OECD Science, Technology and Industry, https://www.doczj.com/doc/169250169.html,/sti .? OECD Telecommunications and Internet Policy, https://www.doczj.com/doc/169250169.html,/sti/telecom .
Long-term trends
The ICT sector grew strongly in OECD countries over the 1990s. The share of ICT services has grown most in the Czech Republic, Finland, Korea and Sweden. In Finland, the ICT manufacturing sector’s share of manufacturing value added doubled over 1995-2001 and now represents 23% of total manufacturing value added. In 2001, the ICT manufacturing sector represented between 2.2% and 22.9% of total
manufacturing value added in OECD countries. The average share for the 25 OECD countries for which data are available was about 7% and was slightly lower in the European Union.
The ICT services sector is largest, at over 12% of
business services value added in the Czech Republic, Finland, Ireland and Sweden. It is smallest in Mexico, Japan and the Slovak Republic.
In most OECD countries, ICT services have
increased their relative share of business services value added, owing to the increasing importance of telecommunication services and software in OECD countries and, more broadly, a general shift towards a services economy. For example, most OECD countries already have a well-developed telecommunication services sector, which makes a sizeable contribution to ICT value added. At the same time, there has been a noticeable increase in the contribution of computer and related services, mainly software services.
SIZE OF THE ICT SECTOR
Information and communication technologies (ICT) have been at the heart of economic changes for more than a decade. ICT-producing sectors play an important role, notably by contributing to rapid technological progress and productivity growth.
De?nition
In 1998, the OECD countries reached agreement on an industry-based de?nition of the ICT sector based on Revision 3 of the International Standard Industrial Classi?cation (ISIC Rev. 3). The principles underlying the de?nition are the following.
For manufacturing industries, the products of a candidate industry must be intended to ful?ll the function of information processing and communication including transmission and display, must use electronic processing to detect, measure and/or record physical phenomena or control a physical process.
For services industries, the products of a candidate industry must be intended to enable the function of information processing and communication by electronic means.
Comparability
The existence of a widely accepted de?nition of the ICT sector is the ?rst step towards making comparisons across time and countries possible. However, the de?nition is not as yet consistently applied and data provided by member countries have been combined with different data sources to estimate ICT aggregates compatible with national accounts totals. For this reason, statistics presented here may differ from ?gures contained in national reports and in previous OECD publications.
SCIENCE AND TECHNOLOGY ? ICT
SCIENCE AND TECHNOLOGY ? ICT
SIZE OF THE ICT SECTOR
Share of ICT in value added, 2001
Share of ICT in services
Share of ICT in manufacturing
As a percentage of total business services value added
As a percentage of total manufacturing value added
510152025303540G
r e
e c e
S l
o v
a k R e p u
b l i
c M
e x
i c o B e
l g i
u m A
u s
t r a
l i a G e
r m
a n
y S
p a
i n I t a
l y C a
n a
d a P o
r t u
g a l N o
r w
a y S w
e d
e n D e
n m
a r
k F
r a
n c e C z
e c
h R
e p u
b l i
c O E
C D
t o t a
l
A u
s t r i
a
E U
15N e
t h
e r
l a n d
s
J a
p a
n H
u n g a r
y
U
n i t
e d K
i n g
d o m U n
i t
e
d S t a t e
s
K o
r e
a
I r e
l a
n d
F i n
l a n
d
ICT in manufacturing
ICT in services
StatLink: https://www.doczj.com/doc/169250169.html,/10.1787/0357********
StatLink: https://www.doczj.com/doc/169250169.html,/10.1787/258771878113
Share of ICT in value added
As a percentage of total business services and total manufacturing value added, 2001
Source
? OECD Productivity Database .
Futher information
Analytical publications
? OECD (2003), ICT and Economic Growth: Evidence from OECD countries, industries and ?rms , OECD, Paris.
? OECD (2005), OECD Communications Outlook , OECD, Paris.? OECD (2005), OECD Information Technology Outlook , OECD, Paris.
? OECD (2005), OECD Science, Technology and Industry Scoreboard , OECD, Paris.
Statistical publications
? OECD (2005), National Accounts of OECD Countries , OECD, Paris.
? OECD (2005), STAN Industry Structural Analysis Database on CD-Rom , OECD, Paris.
Methodological publications
? Ahmad, N. (2003), Measuring Investment in Software , OECD Science, Technology and Industry Working Papers, No. 2003/6, OECD, Paris.
? Lequillier, F . et al. (2003), Report of the OECD Task Force on Software Measurement in the National Accounts , OECD Statistics Working Papers, No. 2003/1, OECD, Paris.? Schreyer, P ., P .-E. Bignon and J. Dupont (2003), OECD
Capital Services Estimates , OECD Statistics Working Papers, No. 2003/6, OECD, Paris.
Online databases
? STAN: OECD Structural Analysis Statistics – online database .
Web sites
? OECD Productivity Database,
https://www.doczj.com/doc/169250169.html,/statistics/productivity .
Long-term trends
ICT shares in total non-residential investment doubled, and in some cases, even quadrupled between 1980 and 2003. In 2002/2003, ICT shares were particularly high in Sweden, Finland, Australia and the United States.
Software has been the fastest growing component of ICT investment. In many countries, its share in non-residential investment multiplied several times between 1980 and 2003. Software’s share in total investment is highest in Denmark, Finland, Sweden and the United States.
INVESTMENT IN ICT
Investment in physical capital is important for growth. It is a way to expand and renew the capital stock and enable new technologies to enter the production process. Information and communication technology (ICT) has been the most dynamic component of investment in recent years.
De?nition
Investment is de?ned in accordance with the 1993 System of National Accounts . It covers the acquisition of equipment and computer software that is used in production for more than one year. ICT has three components: information technology equipment (computers and related hardware), communications equipment and software. Software includes acquisition of pre-packaged software, customised software and software developed in house.
The investment shares shown in the table and graph are percentages of each country ’s gross ?xed capital formation, excluding residential construction.
Comparability
Correct measurement of ICT investment in both nominal and volume terms is crucial for estimating the contribution of ICT to economic growth and performance. Data availability and measurement of ICT investment based on national accounts vary considerably across OECD countries, especially as regards the measurement of investment in software, the methods of de?ation, the breakdown by institutional sector and the length of time series.
Expenditure on software has only recently been treated as investment in the national accounts, and methodologies still vary across countries. The United States is among the few countries that produces estimates of expenditure on the three separate software components; other countries usually provide estimates for some software components only. To tackle the speci?c problems relating to software in the national accounts, a joint OECD-EU task force on the measurement of software in the national accounts has developed recommendations concerning the capitalisation of software.
Note that ICT components that are incorporated in other products, such as motor vehicles or machine tools, are included in the value of those other products and are excluded from ICT investment as de?ned here.
SCIENCE AND TECHNOLOGY ? ICT
SCIENCE AND TECHNOLOGY ? ICT
INVESTMENT IN ICT
Shares of ICT investment in non-residential fixed capital formation
As a percentage of total non-residential fixed capital formation, total economy
1990
1991199219931994199519961997199819992000200120022003
Belgium 17.717.818.815.916.918.018.419.421.521.724.223.3
20.319.9Canada 13.214.216.116.916.416.818.017.518.819.920.620.119.318.4Denmark 16.617.017.619.317.519.119.119.619.120.219.518.819.419.6Finland 12.414.818.522.925.725.820.225.125.226.426.325.927.626.6France 7.87.57.68.18.69.09.811.011.912.212.813.213.7..Germany 13.913.713.213.313.213.314.214.715.316.517.417.816.915.5Greece 7.59.39.313.211.710.010.911.012.411.712.814.311.510.8Ireland 4.3 5.7 5.7 5.8 6.79.68.78.29.610.914.211.49.68.1Italy 14.214.214.214.315.114.815.116.315.915.416.116.915.715.8Japan 8.28.88.99.19.110.312.512.412.914.214.714.713.6..Korea ..........12.212.713.515.218.120.820.018.816.4Netherlands 12.712.413.013.713.513.114.015.517.117.617.717.716.817.8New Zealand 16.717.617.715.816.014.915.316.218.918.121.019.519.6..Norway 8.68.08.48.49.39.99.810.09.610.911.812.512.6..Portugal 9.711.310.610.711.412.212.212.013.013.412.413.111.913.6Spain 13.912.611.712.713.012.714.614.414.715.616.015.314.1..Sweden 15.716.919.424.623.823.522.724.226.327.930.527.825.526.6United Kingdom 14.314.815.617.219.121.722.721.324.323.725.023.422.021.8United States
24.7
26.5
28.0
27.2
26.8
27.6
28.5
29.6
30.1
32.4
34.2
32.9
32.4
33.2
5
10
15
20
25
30
35
I r e l a n d G
r e e c e
N
o r w a y
A
u s
t r
i a P o
r t u
g a
J a
p a n F
r a n c e S p
a i n
G e
r m a n y I t a
l y K o
r e
a N e
t h e r l a n d s C a n a d a D e n m a r k N e w Z e a l a n d B e l g i u m U n
i t
e d K i n g d o m A u s t r a l i a F i n l a n d
S w e d e n U
n i t e d S t a t e s StatLink: https://www.doczj.com/doc/169250169.html,/10.1787/038634684230
StatLink: https://www.doczj.com/doc/169250169.html,/10.1787/664638322102
Shares of ICT investment in non-residential ?xed capital formation
As a percentage of total non-residential ?xed capital formation, total economy, 2003 or latest available year
Source
? OECD (2005), OECD Science, Technology and Industry Scoreboard , OECD, Paris.
Futher information
Analytical publications
? OECD (2004), Access Pricing in Telecommunications , OECD, Paris.
? OECD (2005), OECD Communications Outlook , OECD, Paris.
Statistical publications
? Eurostat (2005), Eurostat community survey on ICT usage in households and by individuals , May 2005, Eurostat, Luxemboug.
? OECD (2003), OECD Telecommunications Database , CD-Rom, OECD, Paris.
Web sites
? OECD Science, Technology and Industry, https://www.doczj.com/doc/169250169.html,/sti .? OECD Telecommunications and Internet Policy, https://www.doczj.com/doc/169250169.html,/sti/telecom .
Long-term trends
Penetration rates are high in Iceland, Denmark, Korea, Japan and Norway, where more than 70% of households had access to a home computer by 2004. On the other hand, shares in the Czech Republic, Greece, Mexico and T urkey were below 30%. Between 2000 and 2004, the percentages of households with access to a home computer increased particularly sharply in Austria, France and Japan.
The picture with regard to Internet access is similar. In Korea, Iceland, Denmark, Switzerland, Norway and Germany, more than 60% of households had Internet access by 2004. In the Czech Republic, Greece, Hungary, Mexico and T urkey, on the other hand, only about one-?fth or less had Internet access by 2004.
Data on Internet access by household composition – with or without dependent children – are available for most OECD countries. In general, they show that households with children were more likely to have Internet access at home in 2004.
COMPUTER AND INTERNET ACCESS BY HOUSEHOLDS
Computers are increasingly present in homes in OECD countries, both in countries that already have high penetration rates and in those where adoption has lagged.
De?nition
The table shows the number of households that reported having at least one personal computer in working order. The second part of the table shows the percentage of households who reported that they had access to the Internet. In almost all cases, this access is via a personal computer, either using a dial-up, DSL, ?bre optic and other broadband access.
Comparability
Over a very short period, national statistical of?ces have made great progress in providing indicators of the use of information and communication technology. From an international perspective, the major drawback of of?cial statistics on ICT use is that they remain based on different standards and measure rapidly changing behaviour at different points in time. Most countries use existing surveys, such as labour force, time use, household expenditure or general social surveys. Others rely on special surveys.
Another issue for international comparability is the choice between households and individuals as the survey unit. Household surveys generally provide information on both the household and the individuals in the household. Person-based data typically provide information on the number of individuals with access to a technology, those using the technology, the location at which they use it and the purpose of use.
Statistics on ICT use by households may run into problems of international comparability because of structural differences in the composition of households. On the other hand, statistics on individuals may use different age groups, and age is an important determinant of ICT use. Household-based and person-based measures yield different ?gures in terms of levels and growth rates. Such differences complicate international comparisons and make benchmarking exercises based on a single indicator of Internet access or use misleading, since country rankings change according to the indicator used.
The OECD and Eurostat have addressed issues of international comparability by developing a model survey on ICT use in households/by individuals. The model survey is designed to be ?exible; it uses modules addressing different topics so that additional components can be added as technologies re?ecting usage practices and policy interests change.
In the case of Korea, data for 2000 to 2003 includes Internet access only via computer. In the 2004 survey, Internet access through mobile phone was also included. The value for 2004 excluding mobile phone access is 72.2%.
SCIENCE AND TECHNOLOGY ? ICT
SCIENCE AND TECHNOLOGY ? ICT
COMPUTER AND INTERNET ACCESS BY HOUSEHOLDS
Households with access to home computers and the Internet
Percentage of households with access to a home computer
Percentage of households with access to the Internet
102030405060708090T u r k e y M e x i c o G r e e c e C z
e c h R e p u b l i c H u n
g a r y P o l a n d
P o r t u g a l I r e l a n d I t a l y F r a n c e S p a i n F i n l a n d A u s t r i a U n i t
e d S t a t e s N e w Z e a l a n d U n
i t e d
K i n g d o m A u s t r a l i a C a n a d a L u
x e m b o u r g
G e r m
a n y S w i t z e r l a n d
N e t h e r l a n d s S w e d e n N o r w a y J a p a n K o r e a D e
n m a r k I c e l a n
d StatLink: https://www.doczj.com/doc/169250169.html,/10.1787/410308230871
StatLink: https://www.doczj.com/doc/169250169.html,/10.1787/714767423678
Households with access to a home computer
Percentage of all households, 2004 or latest available year
Sources
? ITCS International Trade by Commodity Statistics .
? STAN: OECD Structural Analysis Statistics – online database .
Futher information
Analytical publications
? OECD (2005), OECD Information Technology Outlook , OECD, Paris.
Methodological publications
? OECD (2003), A proposed classi?cation of ICT goods , OECD, Paris, https://www.doczj.com/doc/169250169.html,/dataoecd/5/61/22343094.pdf .
Web sites
? OECD Key ICT indicators, https://www.doczj.com/doc/169250169.html,/sti/ictindicators .
Long-term trends
Growth of exports has been particularly high for the countries that started with a low base in 1996 – Hungary, the Czech Republic and the Slovak
Republic, Poland, T urkey and Iceland. In the United States, Japan, United Kingdom and France, ICT exports were substantial at the beginning of the period and have grown only moderately since then. Germany and especially Korea stand out as countries which started the period with substantial ICT exports and which have seen them grow rapidly between 1996 and 2004.
By the end of the period, the OECD countries
could be divided into three groups – United States, Korea, Japan and Germany with high exports of ICT equipment, a middle group consisting of Ireland, France, Mexico, United Kingdom and the Netherlands and the remainder with relatively low values of ICT exports. As noted above, however, some of these, such as the four Central European countries, are rapidly increasing the value of their ICT exports.
Among the ?ve non-member countries, growth of ICT exports has been slow and steady for all except China which has experienced spectacular growth in exports of ICT equipment. Between 1996 and
2004, the value of ICT exports from China have been growing at an average rate of over 30% per year and in 2004, China’s ICT exports surpassed those of the United States.
EXPORTS OF INFORMATION AND COMMUNICATIONS EQUIPMENT
Exports of communication equipment accounted for much of the growth in trade over the past decade. In all OECD countries, they grew more rapidly than total manufacturing exports. This is especially the case for high-technology exports.
De?nition
The OECD has developed a commodity-based de?nition of the ICT sector based on the CPC (Central Product Classi?cation) and the Harmonised System (HS). The de?nition of ICT goods includes the following broad categories: telecommunications equipment; computer and related equipment; electronic components; audio and video equipment; and other ICT goods.
Comparability
The data for this table are taken from the statistics on international trade. These are compiled according to internationally agreed standards and are generally considered to be of good comparability. Note, however, that the data for Hungary, Mexico, the Netherlands and Spain in the graph refer to 2003 and not 2004.
Exports of ICT equipment
Millions of US dollars
SCIENCE AND TECHNOLOGY ? COMMUNICATIONS
0204060801001201401601802001996
2004
199719981999200020012002
2003
StatLink: https://www.doczj.com/doc/169250169.html,/10.1787/726331185022
SCIENCE AND TECHNOLOGY ? COMMUNICATIONS
EXPORTS OF INFORMATION AND COMMUNICATIONS EQUIPMENT
Exports of ICT equipment
Millions of US dollars
1996
19971998199920002001200220032004
Belgium 84638344937395471145612209105611248713581Canada 1208014913145731573022636
15011120181201614225Czech Republic 8859621513133921283201479059229104Denmark 354838053961401643064138543551365823Finland 593569208656935311630941498221108611506France 258922815632249327683571531534278272819132579Germany 416314370147466507936037359104613657025191308Greece 160219257306480381397456585Hungary 6643298
4763
5943
77767511
893911975
..Iceland 2345129131718Ireland 132711622418638235232635230794271982260923673Italy 130461169711890117811279012829112781254714453Japan 103213104229936121013591235429451895018106655124238Korea 29171
36248
33906
450616152546793550216654586099Luxembourg (111011181517130011031229)
Mexico https://www.doczj.com/doc/169250169.html,herlands 2502227981315913539541218357683158345505..New Zealand 232232299178184168189365464Norway 130114321513150214301526134515221670Poland 6489171296127214241771219026903341Portugal 1369
13831465178118932065201227162899Slovak Republic ..31038640946157362410351811
Spain 49695115579360556137616158977585..Sweden 11164125131322415098166579353102501137514807Switzerland 414139194090433746524298360441324750Turkey 504647104592411151188171421253096United Kingdom 418444334047693492265601953684516574332943678China 18584231942741932663469965530579377123303180422
India
6595453174447148809391262..Russian Federation ..9176097557999809288961137South Africa
..
..
..
..
521
545
493
615
760
20 000
40 00060 00080 000100 000120 000140 000160 000 0
I c e l a n d N e w Z e a l a n d G r e e c e S o u t h A f r i c a R u s s i a n F e d e r a t i o n L u x e m b o u r g I n d i a N o r w a y S l o v a k R e p u b l i c A u s t r a l i a B r a z i l P o r t u g a l T u r k e y P o l a n d S w i t z e r l a n d D e n m a r k S p a i n A u s t r i a C z e c h R e p u b l i c F i n l a n d H u n g a r y B e l g i u m C a n a d a I t a l y S w e d e n I r e l a n d F r a n c e M e x i c o U n i t e d K i n g d o m N e t h e r l a n d s K o r e a G e r m a n y J a p a n U n i t e d S t a t e s C h i n a
StatLink: https://www.doczj.com/doc/169250169.html,/10.1787/416828354285
StatLink: https://www.doczj.com/doc/169250169.html,/10.1787/534150448753
Exports of ICT equipment
Million US dollars, 2004 or latest available year
Sources
? ITU (2005), World Telecommunications Indicators Database .? OECD (2005), OECD Communications Outlook , OECD, Paris.
Futher information
Analytical publications
? Caspary, G. and D. O?Connor (2003), Providing Low-cost Information Technology Access to Rural Communities in Developing Countries: What Works? What Pays?, OECD
Development Centre Working Papers, No. 229, OECD, Paris.
Web sites
? OECD Telecommunications and Internet Policy, https://www.doczj.com/doc/169250169.html,/sti/telecom .
Long-term trends
Access to communications networks continues to expand in all OECD countries. At the end of 2003, the total number of ?xed and mobile
telecommunications paths had increased to more than 1.4 billion. This represented a 6.7% increase over 2002 and an average increase of more than 12% in each year since 1998.
For the ?rst time, however, growth was not occurring across all access paths. The number of cellular mobile communication subscribers continues to climb. An additional 69 million mobile subscribers were added in 2003. By way of contrast, some segments of the ?xed connection market have
begun to decrease. The number of ?xed access lines decreased in both 2002 and 2003 and will most likely continue to do so over the coming years.
Since 1991, growth in access paths per inhabitant has been particularly high in those countries that started from a low base – Hungary, the Czech Republic and Mexico – and somewhat slower in those where the number of access paths per
inhabitant were already quite high, such as Canada and the United States.
By 2003, all but four OECD countries – Mexico, the Slovak Republic, T urkey and Poland – had more than one telecommunications access path per
inhabitant and eight countries reported more than one and a half per inhabitant – Denmark, Finland, Greece, Iceland, Luxembourg, Norway, Sweden and Switzerland.
Among the ?ve non-OECD countries, growth has been spectacular in China, which had less than one access path per 100 inhabitants in 1991 but more than 40 in 2003. For four of the ?ve non-members, access paths per inhabitant are between 40 and 50, with India as the exception. Although there has been steady growth over the period, there were still only about 6 access paths per 100 inhabitants of India in 2003.
TELEPHONE ACCESS
The number of telephone connections – more precisely the number of ?xed and mobile telecommunications access paths – has increased dramatically in OECD countries. This is associated both with growing use of the Internet and, particularly in recent years, with the growing popularity of cellular mobile telephones.
De?nition
For the OECD member countries, access paths are the total of ?xed lines (standard analogue access lines and ISDN channels) plus the number of mobile telephone
subscribers. For Brazil, China, India, Russian Federation and South Africa, access paths are the sum of main telephone lines in operation, ISDN channels and cellular mobile telephone subscribers.
Comparability
For OECD countries, the data are collected according to agreed de?nitions and are highly comparable. The data shown for the ?ve large non-OECD countries are reported by the International Telecommunications Union (ITU). The de?nition used by the ITU is slightly narrower than that used by the OECD, although data reported for the two sets of countries can be regarded as broadly comparable.
SCIENCE AND TECHNOLOGY ? COMMUNICATIONS
Mobile cellular subscribers
OECD and non-OECD share in the world total, 1996-2003
1996
1997199819992000200120022003
0 10 20 30 40 50 60 70 80 90
100StatLink: https://www.doczj.com/doc/169250169.html,/10.1787/838120828061
SCIENCE AND TECHNOLOGY ? COMMUNICATIONS
TELEPHONE ACCESS
Telephone access
Telecommunication access paths per 100inhabitants
1991
199219931994199519961997199819992000200120022003
Belgium 41.543.144.346.348.852.760.766.882.6107.5125.0128.3132.9Canada 59.260.963.066.068.872.577.783.789.797.8105.0106.7108.2
Czech Republic 16.617.719.121.123.729.336.845.856.481.2108.4124.7135.9Denmark 60.762.266.070.077.888.089.4101.1117.0134.0145.5152.6156.1Finland 60.461.463.768.075.986.0100.6117.0127.6139.8147.6152.9154.2France 52.054.054.256.359.758.464.275.190.4105.2116.7118.7122.8Germany 43.045.949.454.156.061.065.073.687.2119.7131.7136.7144.3Greece ....45.248.451.154.859.270.388.3109.0129.3142.5151.5Hungary 11.012.715.218.824.130.737.744.552.067.385.5103.9114.0Iceland 57.559.561.064.067.275.885.0103.0129.9145.4149.8157.3163.2Ireland 30.632.634.336.840.146.354.969.589.0100.5120.0128.2134.2Italy 41.643.144.546.950.655.365.881.299.1120.2136.8140.9146.3Japan 46.748.049.3....72.482.690.9100.6111.2116.6119.9122.9Korea 34.036.338.841.745.650.860.575.3108.9115.1118.8126.3128.5Luxembourg 49.552.555.358.562.971.478.985.9110.4142.8176.5185.6216.3Mexico 7.48.39.1....10.711.713.919.226.835.643.348.2Netherlands 48.449.851.353.256.061.572.770.8103.8132.9133.9134.9142.9New Zealand 45.847.347.852.656.258.364.878.885.7101.6107.0109.2117.8Norway 56.959.462.768.979.187.9100.2113.7132.7147.9156.9160.1162.3Poland ..10.311.513.115.017.521.527.035.046.358.768.678.5Portugal 27.431.033.836.639.544.454.571.087.5107.4120.1124.3130.4Slovak Republic ....16.818.921.123.729.637.243.256.170.182.695.0Spain 34.435.837.238.640.947.452.660.482.4107.0120.7130.8142.2Sweden 75.776.277.583.991.397.5106.0118.0131.6147.4156.0162.7170.1Switzerland 62.664.165.768.371.971.980.691.6113.3137.0146.3151.5155.5Turkey 14.416.320.622.523.724.127.231.639.349.654.560.966.4United Kingdom 46.647.951.256.061.264.469.079.399.2127.9136.3143.5147.5China 0.7 1.0 1.5 2.4 3.6 5.0 6.78.912.017.824.932.841.3India
0.70.80.9 1.1 1.3 1.6 2.0 2.3 2.8 3.6 4.4 5.2 6.4Russian Federation 15.015.415.916.317.017.719.520.421.924.028.036.250.2South Africa
9.5
9.4
9.6
10.7
11.5
13.0
15.9
20.3
25.4
31.3
36.3
42.0
48.2
50
100
150
200
250
I n d
i a C h i n a M e x i c o S o u t h A f r i c a B r a z i l R u s s i a T u r k e y P o l a n d S l o v a k R e p u b l i c C a n a d a H u n g a r y U n i t e d S t a t e s N e w Z e a l a n d F r a n c e J a p a n K o r e a P o r t u g a l O E C D a v e r a g e B e l g i u m A u s t r a l i a I r e l a n d A u s t r i a C z e c h R e p u b l i c S p a i n N e t h e r l a n d s G e r m a n y I t a l y U n i t e
d K i n g d o m G r
e e c e F i n l a n d S w i t z e r l a n d D e n m a r k N o r w a y I c e l a n d S w e d e n L u x e m b o u r g
StatLink: https://www.doczj.com/doc/169250169.html,/10.1787/558502843155
StatLink: https://www.doczj.com/doc/169250169.html,/10.1787/565171165723
Telephone access
Number of telecommunication access paths per 100 inhabitants, 2003
中国在亚太经合组织中的作用与影响 08历史1班易正权学号:200802021029 内容摘要: 中国作为世界上最大的发展中国家,尤其是1978年十届三中全会以来,中国实行改革开放的伟大决策。中国的发展让世界震惊,让是人刮目相看。30年来,中国的经济取得举世瞩目的成就,提高中国的综合国力与国际地位;同时,改变世界的面貌,推动世界多极化的进程。中国经济的快速发展,和平崛起,很大程度上受益于区域经济;尤其是亚太经济组织(APEC)。APEC是中国对外贸易的重要依托。中国对外贸易的大约70%,吸引外资的70%以上来自于APEC中各成员。APEC为中国经济的发展提供机遇;同样,中国也为APEC 经济的发展提供广阔的市场。中国经济的发展壮大与APEC紧密相连,APEC的发展离不开中国,中国的发展同样需要APEC。没有中国的参与,APEC是不完整的。 关键词:APEC;中国;作用;影响 1991年中国正式加入APEC,中国加入APEC就是重要的一员。加入APEC提高中国作为地区领导者以及在全球舞台上的地位。由于APEC是距离中国最近的区域组织,又是中国最重要的出口市场。不言而喻,中国队APEC的区域经济发展起到举足轻重的作用。APEC需要中国,中国也需要APEC;伴随着中国经济的崛起,队APEC的影响越来越大。APEC让世界看到中国,加入APEC也为中国提供一个平台,使当时的世界更有机会听到中国的声音。伴随中国经济的发展,APEC更加重视中国,重视中国队APEC所做的贡献。APEC本身就是一个具有巨大生命力的,前途的市场:人口25亿,占世界总人口的45%,经济总量占世界的55%,贸易总量占世界的50%,它包括世界三大经济体,金砖四国中的三个,可以说他代表半个世界。[1](P388)显然与中国这个亚洲最具潜力的市场具有巨大的地缘优势,APEC与中国有很强的互补性。中国加入APEC可以因势利导的规划中国的改革开放,同时也为APEC的发展注入新的血液。 一、中国在APEC中的作用 第一,中国在APEC中的劳动密集型出口产品竞争加剧 自从经济改革以来,中国出口的增长主要在劳动密集型产品。目前,中国已超过南韩、台湾、香港和新加坡(四小龙),一跃成为亚太地区的头号劳动密集型产品的出口国。在1 978年,四小龙向工业国出口的劳动密集型产品占了亚太地区劳动密集型产品总出口的70%以上,而中国则不到中国经济在亚太经济发展中的地位和作用10%。1978年亚洲向工业国家出口的劳动密集型产品市场份额。如下图[2]
世界发达国家衡量标准联合国开发计划署 以前人们界定一个国家是否属于发达国家,都是用人均GDP来界定,但单独用人均GDP 显然存在很多缺点,首先是人均GDP很不稳定,受汇率、物价等影响而波动很大,其次人均GDP也只代表了经济水平,而不能代表一个国家的全面发展水平。对此,联合国的开发计划署编制了“人类发展指数”,用以取代单一的人均GDP衡量体系,以此来界定一个国家是否属于发达国家,就相对全面客观了。目前的具体标准是:人类发展指数不低于0.9即为发达国家。 最新世界分组 联合国开发计划署(UNDP)2010年11月4日发布的《2010年人文发展报告》对世界各国的分组进行了重新的修正,修正后,发达国家或地区的数量由2009年的38个,上升的2010年的44个,增加了6个 2010年发达国家数量 经济合作与发展组织中的发达经济体(28个国家) 澳大利亚、奥地利、比利时、加拿大、捷克、丹麦、芬兰、法国、德国、希腊、匈牙利、冰岛、爱尔兰、意大利、日本、韩国、卢森堡、荷兰、新西兰、挪威、波兰、葡萄牙、斯洛伐克、西班牙、瑞典、瑞士、美国、英国非经济合作与发展组织中的发达经济体(16个国家或地区) 安道尔、巴林、巴巴多斯、文莱、塞浦路斯、爱沙尼亚、中国香港、以色列、列支敦士登、马耳他、摩纳哥、卡塔尔、圣马力诺、新加坡、斯洛文尼亚、阿联酋 2010年发展中国家 阿拉伯国家(16个国家或地区) 阿尔及利亚、吉布提、埃及、伊拉克、约旦、科威特、黎巴嫩、摩洛哥、巴勒斯坦被占领土、阿曼、沙特阿拉伯、索马里、苏丹、叙利亚、突尼斯、也门东亚及太平洋地区(24个国家) 柬埔寨、中国、斐济、印度尼西亚、基里巴斯、朝鲜、老挝、马来西亚、马绍尔群岛、密克罗尼西亚、蒙古、缅甸、瑙鲁、帕劳、巴布亚新几内亚、菲律宾、萨摩亚、所罗门群岛、泰国、东帝汶、汤加、图瓦卢、瓦努阿图、越南欧洲及独联体地区(23个国家) 阿尔巴尼亚、亚美尼亚、阿塞拜疆、白俄罗斯、波黑、保加利亚、克罗地亚、格鲁吉亚、哈萨克斯坦(中等发达国家)、吉尔吉斯斯坦、拉脱维亚、立陶宛、摩尔多瓦、黑山、罗马尼亚、俄罗斯、塞尔维亚、塔吉克斯坦、马其顿、土耳其(中等发达国家)、土库曼斯坦、乌克兰、乌兹别克斯坦拉丁美洲及加勒比海地区(32个国家或地区) 安提瓜和巴布达、阿根廷、巴哈马、伯利兹、玻利维亚、巴西、智利、哥伦比亚、哥斯达黎加、古巴、多米尼克、多米尼加、厄瓜多尔、萨尔瓦多、格林纳达、危地、马拉圭亚那、海地、洪都拉斯、牙买加、墨西哥、尼加拉瓜、巴拿马、巴拉圭、秘鲁、圣基茨和尼维斯、圣卢西亚、圣文森特和格林纳丁斯、苏里南、特立尼达和多巴哥、乌拉圭、委内瑞拉南亚地区(8个国家或地区) 阿富汗、孟加拉国、不丹、印度、马尔代夫、尼泊尔、巴基斯坦、斯里兰卡撒哈拉以南非洲(45个国家或地区) 安哥拉、贝宁、博茨瓦纳、布基纳法索、布隆迪、喀麦隆、佛得角、中非、乍得、科摩罗、刚果(布)、刚果(金)、科特迪瓦、赤道几内亚、厄立特里亚、埃塞俄比亚、加蓬、冈比亚、加纳、几内亚、几内亚比绍、肯尼亚、莱索托、利比亚里、马达加斯加、马拉维、马里、毛里塔尼亚、毛里求斯、莫桑比克、纳米比亚、尼日尔、尼日利亚、卢旺达、圣多美和普林西比、塞
OECD Science, Technology and Industry Scoreboard https://www.doczj.com/doc/169250169.html,/sti/scoreboard KEY FINDINGS: USA Between 2008-2010, the OECD as a whole suffered over 13 million job losses – about half of which occurred in the United States. The US faces extraordinary challenges – with national debt levels rising and unemployment high. Innovation is critical for equipping countries to respond to the pace and scale of globalisation and find new and sustainable sources of growth and competitiveness. STI Scoreboard data shows that US government and business investment in knowledge, research and innovation provides strong fundamentals for the future. But with the rise of the BRICS countries, there are a number of innovation policy areas that should be closely reviewed –public and private financing, direct (or indirect) support for business, ensuring continued technological advantage and the competition in the global jobs market for highly skilled science graduates. Where people lost their jobs, selected countries, 2008-09 Relative contribution to change in total employment by major sectors of economic activity and national statistical institutes, June 2011. Statlink: https://www.doczj.com/doc/169250169.html,/10.1787/888932484797 Continued strong investment – public and private sector The US has an unmatched national science and innovation system in terms of investment, size and reach. With nearly USD 400bn expenditure in 2009, the United States is the largest performer of research and development (R&D) in the world. Although China has recently become the second largest (USD 154 billion at purchasing power parity - PPP), the share of GDP that the United States devotes to R&D (2.7%) remains much higher than in China (1.7%). Personnel costs, which include researcher costs, in most economies account for the largest share R&D expenditures. This explains the close relationship between R&D as a percentage of GDP and number of researchers as a percentage of total employment. 1
三十个成员国的代表在专业委员会会面,就具体政策领域,如经济、贸易、科学、就业、教育及金融市场,提出建议并审议在这些领域所取得的进展。经合组织共有约二百个委员会、工作组和专家小组。 每年有四千多名来自各成员国政府部门的高级官员参加经合组织委员会会议,对经合组织秘书处开展的工作提出要求,进行审议并发挥作用。即使在自己的国家,他们也可以通过网上途径获得经合组织的文件,并通过特别联网交换信息。 3、理事会 理事会是经合组织的决策机构,由每个成员国及欧洲委员会各派一名代表组成。理事会定期召开成员国驻经合组织大使级会议,并通过综合一致意见的方式进行决策。理事会每年举行一次部长级会议,讨论重要问题,并为经合组织的工作确定重点。理事会指定的工作则由经合组织秘书处的各个司局来完成。 4、秘书处 经合组织秘书处设在巴黎,两千多名工作人员支持着委员会的工作。七百多名经济学家、律师、科学家和其他专业人员从事研究和分析工作。他们主要分布于十二个业务司局。 秘书处的工作是和委员会的工作平行的,每个司局服务于一个或多个委员会,以及委员会属下的工作组和分组。 秘书处由一名秘书长领导,四名副秘书长协助工作。秘书长还是理事会主席,是成员国代表团和秘书处之间的重要联系。 英语和法语是经合组织的两种官方工作语言。经合组织的职员都是成员国公民,但他们在经合组织任职期间以国际行政人员的身份工作,不代表各自国家。经合组织对职员的国别没有配额限制,只本着平等机会的政策,聘用来自各个国家,拥有不同领域经验的高素质人员。 5、资金来源 经合组织是由其三十个成员国资助的。各国向经合组织年度预算捐款的比例根据一个与其经济规模相关的公式而确定。最大捐款国是美国,它提供了经合组织预算的四分之一,其次是日本。经过理事会批准,各国也可以向一些特殊活动或项目提供不包括在主要预算之内的单独资助。 经合组织的年度预算及工作方案都由理事会决定。目前经合组织的年度预算约为三亿欧元。四、功能和运作 经合组织在政策研究和分析的基础上,提供一个思考和讨论问题的场所,以帮助各国政府制定政策,这些政策可能促成成员国政府间的正式协议,也可能在国内或其它国际场合实施。与世界银行或国际货币基金组织不同,经合组织并不发放资金。 与世界银行和国际货币基金组织不同,经合组织并不提供基金援助。它是在政策和分析的基础上,提供一个思考和讨论问题的场所,以帮助各国政府制定政策,这些政策可能导致成员国政府间达成正式协议,或在国内或其他国际场合实施。这一作用对于各成员国非常重要。这个高效机制
行业发展研究资料(No.2005-5) 经合组织公司治理原则(2004版) ─────────────────────────────1999年,经合组织成员国的部长们签署了《经合组织公司治理原则》(以下简称《原则》)。自1999年发布以来,该《原则》作为良好公司治理的国际基准获得了世界范围的承认。这些原则被经合组织国家和非经合组织国家的政府、监管者、投资者、公司和利益相关者积极运用,并被“金融稳定论坛”采纳为“良好金融体系的十二项关键标准”之一。2002年,经合组织开始对该《原则》进行修订,于2004年修订完成并发布。 公司治理对注册会计师保持独立性、规避执业风险有着重要的意义,为了帮助大家了解国际上关于公司治理的通行标准,我们组织翻译了本《原则》。现予编发,供参考。 ───────────────────────────── 中国注册会计师协会编 二OO五年六月二十二日
经合组织公司治理原则 经济合作与发展组织 根据1960年12月14日在巴黎签署的,并于1961年9月30日生效之协定的第1条款,经济合作发展组织(OECD)将坚持以下宗旨: ——实现可持续的最高经济增长及就业,实现成员国生活水平的提高,同时保持金融稳定,从而为世界经济的 发展做出贡献; ——促进成员国与非成员国在经济发展进程中实现全面经济扩张; ——在承担国际责任与义务的条件下,为非歧视基础上的多边世界贸易的发展做出贡献。 经合组织(OECD)的创始成员国有:奥地利、比利时、加拿大、丹麦、法国、德国、希腊、冰岛、爱尔兰、意大利、卢森堡、荷兰、挪威、葡萄牙、西班牙、瑞典、瑞士、土耳其、英国和美国。以后依次加入的国家有(以附后的加入时间为序):日本(1964,4,28)、芬兰(1969,1,28)、澳大利亚(1971,6,7)、新西兰(1973,5,29)、墨西哥(1994,5,18)、捷克(1995,12,21)、匈牙利(1996,5,7)、波兰(1996,11,22)、韩国(1996,12,12)和斯洛伐克(2000,12,14)。欧盟委员会也参与了经合组织的工作(经合组织协定第13条)。
二战后至二十世纪末期产生的与中国关系最为密切的经济组 织(节选) 国际经济组织的发展经历了一个漫长的过程,它是随着世界经济的发展而发展起来的。国际经济组织是国家间经济联系密切发展的客观要求,它的产生是资本主义发展到一定阶段的产物。尤其是第二次世界大战以后,帝国主义殖民体系的崩溃以及各国在经济上存在愈来愈密切的相互依存关系,使得国际经济租住得到了迅速发展。这一时期活跃在世界经济舞台上的国际经济组织,如关税与贸易总协定(也被简称为"关贸总协定")、国际货币基金组织、世界银行、欧洲联盟、亚太经合组织等几乎全部是二战以后才建立起来的。 其中,亚太经合组织、国际货币基金组织、世界贸易组织、联合国与中国关系甚微密切。 1.亚太经合组织 亚太经济合作组织是亚太地区的一个主要经济合作组织。1989年1月,澳大利亚总理霍克访问韩国时建议召开部长级会议,讨论加强亚太经济合作问题。经与有关国家磋商,1989年11月5日至7日,澳大利亚、美国、加拿大、日本、韩国、新西兰和东盟6国在澳大利亚首都堪培拉举行亚太经济合作会议首届部长级会议,这标志着亚太经济合作会议的成立。1993年6月改名为亚太经济合作组织,简称亚太经合组织或APEC。 自中国加入亚太经合组织以来,亚太经合组织便成为中国与亚太地区其他经济体开展互利合作、开展多边外交、展示中国国家形象的重要舞台。作为亚太大家庭的一员,中国一贯重视并积极参与亚太经合组织各领域合作。中国国家主席出席了历次亚太经合组织领导人非正式会议,提出了许多积极、平衡、合理的政策主张和倡议,得到了亚太各经济体的接受和赞同。 亚太地区是中国对外经济贸易的重要依托。中国对外贸易的大约70%、吸引外国直接投资的70%以上来自亚太经合组织成员,中国的发展很大程度上受益于区域经济。中国在亚太经合组织内发挥着极具建设性的作用。中国通过参加亚太经合组织的一系列活动,推动国际秩序朝着更加公正合理的方向发展。 2001年10月20日,亚太经合组织第九次领导人非正式会议在中国上海成功举行。会议通过了《亚太经合组织经济领导人宣言》《上海共识》和《数字亚太经合组织战略》等重要文件,有力推动了中国与亚太经合组织有关成员双边关系的发展。 中国坚持人民币不贬值,才使东南亚国家减少了由于亚洲金融危机而蒙受的损失。中国成为APEC的成员提高了其作为地区领导者以及在全球舞台上的作用。中国作为APEC的成员正日益发挥着重要的作用。无论在经济发展还是贸易自由化,无论是在反恐还是在维护地区和世界的和平与稳定,中国的贡献都是积极而重大的, 发挥着经济和政治主导作用。 2.国际货币基金组织 国际货币基金组织(IMF)是一个政府间国际金融组织,总部设在美国首都
经合组织负责任商业行为研讨会 2018 年 12 月 13 日 09:00 – 16:30 皇冠假日酒店 广州市越秀区环市东路 339 号 商业活动是经济的引擎,对促进经济、环境与社会的进步发挥重要贡献。为了达到这些积极的影响,企业应该确保避免、处理与自身活动相关的负面影响。在企业自身活动及整个业务供应链中推广负责任的商业行为能够保障全球贸易和投资的可持续发展,是营造健康营商环境的关键因素——将有助于吸引高质量投资,减少企业风险,确保利益相关方权利,促进实现创造更广泛的价值。 本次研讨会将概述经济合作与发展组织(简称“经合组织”或OECD)和国际劳工组织等机构有关负责任的商业行为的主要国际政策标准,并向与会者提供企业如何在供应链中应用这些方法的具体例子。 经合组织继续走在国际合作前列,支持政府和企业在贸易和投资领域实现经济、环境与社会发展目标采取的努力,与包括中国在内的全球各地合作伙伴展开了多年的合作,推广责任投资和负责任的商业行为。 本次研讨会向来自政府、商业及社会组织等不同背景的代表开放,旨在介绍负责任商业行为领域的主要工作和关键的概念,帮助理解中国企业在本土及海外实践负责任商业行为和促进可持续发展过程中所面临的主要机遇和挑战。经合组织与中国工业经济联合会合作举办本次研讨会。此次活动还得益于经合组织和责扬天下的合作关系。 -------------------------------------------------------------------------------------------------------------------------------- 更多信息 经合组织制定了关于负责任的商业行为最全面的国际法律文书《经合组织跨国 企业准则》以及切实可行的指引和工具,帮助企业就环境和社会问题开展基于 风险的尽责管理,以避免和解决与其经营活动、供应链和其他业务关系相关的 负面影响。经合组织的《准则》与《联合国工商企业与人权指导原则》和国际 劳工组织的基本公约相互一致,并在贸易和投资协定中被引用。 中国是经合组织的关键伙伴国。双方就负责任的商业行为的合作重点是支持中国在该领域相关的行业标准与国际标准的结合。在中国和经合组织2015-16年联合工作计划的建设性合作成果的基础上,双方正在讨论制定一份新的联合工作计划,其中包括加强在负责任的商业行为领域的合作。该合作将建立在经合组织和中国现有及持续发展的伙伴关系的基础上,并得到欧盟-国际劳工组织-经合组织“在亚洲推广负责任的供应链”合作项目的支持,该项目涉及含中国在内6个亚洲国家,执行期为2018-2020年。
第二章当代世界经济 一、选择题 1.[单选题]确立了美元在战后国际金融领域的中心地位的是()。 A.世界贸易组织协定 B.布雷顿森林协定 C.关税与贸易总协定 D.《国际货币基金协定》 【答案】B 【解析】1944年7月,在美国的新罕布什尔州布雷顿森林召开了有44个国家参加的国际货币金融会议,通过了《联合国货币金融会议最后决议书》及《国际货币基金协定》、《国际复兴开发银行协定》两个附件,总称“布雷顿森林协定”。“布雷顿森林协定”建立的以美元为中心的货币体系,实际上是一种国际基金汇兑本位制。这就意味着美元成了主要的国际储备货币,可以替代黄金作为国际支付手段,确立了美元在战后资本主义世界金融领域的中心地位。 2.[单选题]下列国际组织中,以协助成员国稳定汇率、平衡外汇收支为主要宗旨的是()。 A.世界贸易组织 B.国际清算银行
C.国际货币基金组织 D.世界银行 【答案】C 【解析】国际货币基金组织(简称IMF)是根据1944年7月在布雷顿森林会议签订的《国际货币基金协定》,于1945年12月27日在华盛顿成立的。它是一个政府间国际金融组织,其总部设在美国首都华盛顿。国际货币基金组织的宗旨是稳定国际汇兑,消除妨碍世界贸易的外汇管制,在货币问题上促进国际合作,并通过提供短期贷款,协助成员国稳定汇率、平衡外汇收支。 3.[单选题]亚太经合组织的性质是()。 A.超国家一体化组织 B.关税同盟 C.自由贸易区 D.地区经济论坛 【答案】D 【解析】亚太经济合作组织(简称APEC)是亚太地区最具影响的经济合作官方论坛。1989年11月5日至7日,澳大利亚、美国、加拿大、日本、韩国、新西兰和东南亚国家联盟6国在澳大利亚首都堪培拉举行亚太经济合作会议首届部长级会议,这标志着亚太经济合作会议的成立。1993年6月改名为亚太经济合作组织,简称亚太经合组织或APEC。其宗旨包括:①保持经济的增长和发展;②促进成员间经济的相互依存;③加强开放的多边贸易体制;④减少区域贸易和投资壁垒,维护本地区人民的共同利益。
中国与亚太经合组织 新华网北京11月13日电1989年11月,亚太经济合作组织(简称“亚太经合组织”或APEC)成立。1990年7月,亚太经合组织第二届部长级会议在新加坡通过《联合声明》,欢迎中国、中国台北和香港三方尽早同时加入这一组织。1991年11月,在“一个中国”和“区别主权国家和地区经济体”的原则基础上,中国、中国台北和香港(1997年7月1日起改为“中国香港”)正式加入亚太经合组织。 从中国加入亚太经合组织起,亚太经合组织便成为中国与亚太地区其他经济体开展互利合作、开展多边外交、展示中国国家形象的重要舞台。中国通过参与亚太经合组织合作促进了自身发展,也为本地区乃至世界经济发展作出了重要贡献。 作为亚太大家庭的一员,中国一贯重视并积极参与亚太经合组织各领域合作。中国国家主席出席了历次亚太经合组织领导人非正式会议,提出了许多积极、平衡、合理的政策主张和倡议。2001年10月20日,亚太经合组织第九次领导人非正式会议在中国上海成功举行。会议通过了《亚太经合组织经济领导人宣言》《上海共识》《数字亚太经合组织战略》等重要文件,有力推动了中国与亚太经合组织有关成员双边关系的发展。 亚太地区是中国对外经济贸易的重要依托。中国对外贸易的大约70%、吸引外国直接投资的70%以上来自亚太经合组织成员,中国的发展很大程度上受益于区域经济。中国在亚太经合组织内发挥着极具建设性的作用。中国通过参加亚太经合组织的一系列活动,推动国际秩序朝着更加公正合理的方向发展。 最近两年,为应对国际金融危机,中国政府除及时调整宏观经济政策,果断实施扩大内需、促进经济增长等一揽子计划外,积极与包括亚太经合组织在内的国际社会携手合作。去年在新加坡举行的亚太经合组织第十七次领导人非正式会议上,胡锦涛主席宣布,中国政府将拨款1000万美元设立中国亚太经合组织合作基金,用于鼓励和支持中国相关部门和企业参
当代世界政治与经济考试参考答案 单选题 1.当代经济生活国际化的主要承担者和体现者是( D ) A、主权国家 B、主权国家集团 C、世界经济组织 D、跨国公司 2.战后发达资本主义国家阶级结构中兴起的新中间阶层主要是指( D ) A.小手工业者、商人 B.经理资本家 C.中等资产阶级 D.企业中层管理人员、工程技术人员和自由职业者 3.美国最早提出遏制战略理论、具有“遏制理论之父”之称的代表人物是( A ) A.乔治?凯南 B.亨利?基辛格 C.斯坦利?霍夫曼 D.莫顿?卡普兰 4.解决南北问题的根本途径是 ( C ) A、南北对话 B、南南合作 C、改革不合理的国际经济旧秩序 D、反对霸权主义 5.戈尔巴乔夫提出“国际政治新思维”的核心是( A ) A、“全人类利益高于一切” B、人道的、民主的社会主义 C、实现国际关系民主化 D、实现“国际关系人性化” 6. “一国两制”这一方针最早提出是考虑如何解决( A ) A、台湾问题 B、香港问题 C、澳门问题 D、世界各国遗留的国家统一问题 7、宣告建立欧洲联盟的条约是( C ) A、《罗马条约》 B、《欧洲经济共同体条约》 C、《马斯特里赫特条约》 D、《布鲁塞尔条约》 8.谋求世界共同发展的根本途径是( D ) A、维护国际和平环境 B、推动南北对话 C、加强南南合作 D、建立公正、合理、平等、互利的国际经济新秩序 9.战后确立美元在资本主义世界金融领域享有中心地位的是( C ) A、《华盛顿协定》 B、《布鲁塞尔议定书》 C、《布雷顿森林协议》 D、《罗马条约》 10.标志冷战正式形成的是 ( D ) A、马歇尔计划的提出 B、北大西洋公约组织的成立 C、凯南8000 字电报 D、杜鲁门主义的出台 11. 1969年上台的联邦德国政府在对外政策做出重要改变,实施了( A ) A、新东方政策 B、戴高乐主义 C、哈尔斯坦主义 D、三环外交 12.近年来大国之间建立" 伙伴关系", 这种关系是 ( D ) A、结盟关系 B、军事集团关系 C、对立关系 D、既非对立又非结盟关系 13.影响当代世界发展的主要障碍是( C ) A、军备竞赛 B、局部战争 C、国际经济旧秩序 D、发展中国家的贫穷落后 14.亚非国家历史上第一次在没有西方国家参加的情况下自主召开的国际会议是( A )
亚太经济合作组织发展现状 亚太经济合作问题最早是在20世纪60年代初由日本民间人士日本小岛清教授提出来的。1967年在日本商工会议所会长的倡议下,形成了亚太地区第一个规模较大、较正式的经济合作组织——太平洋盆地经济理事会。经过不断的发展,在1989年堪培拉举行的首次亚太经济合作部长级会议标志着亚太经济合作组织(简称APEC)正式成立。现今,亚太经合组织总人口达26亿,约占世界人口的40%;国内生产总值之和超过19万亿美元,约占世界的56%;贸易额约占世界总量的48%。该组织在全球经济活动中具有举足轻重的地位。APEC是亚太地区最具影响的经济合作官方论坛,也是亚太地区最高级别的政府间经济合作机制。 最初提出的有关亚太经济合作的种种设想,都是以日本、美国、加拿大、澳大利亚和新加坡这五个发达国家为对象的,发展中国家被排除在外。随着发展中国家经济的快速发展,才开始吸收亚洲新兴工业化国家(地区)、东盟国家乃至部分拉美国家。直到如今,APEC已经有 21个成员,分别是澳大利亚、文莱、加拿大、智利、中国、中国香港、印度尼西亚、日本、韩国、马来西亚、墨西哥、新西兰、巴布亚新几内亚、秘鲁、菲律宾、俄罗斯、新加坡、中华台北、泰国、美国、越南。我国在1991年以主权国家身份正式加入亚太经合组织。越南在1998年加入,是最后一个成员。关于组织成员问题,早在1997年温哥华领导人会议时就宣布APEC进入十年巩固期,暂不接纳新成员。直到2007年,各国领导人对重新吸纳新成员的问题进行了讨论,但在新成员须满足的标准问题上未达成一致,于是决定将暂停扩容的期限延长3年。从长远来讲,另外一些国家的加入只是时间问题,而这些国家一旦被接纳,APEC则有可能成为一个超越区域范围的组织。 亚太经合组织的组织机构包括领导人非正式会议、部长级会议、高官会、委员会和专题工作组等。其中,领导人非正式会议是亚太经合组织最高级别的会议。APEC主要讨论与全球及区域经济有关的议题,如促进全球多边贸易体制,实施亚太地区贸易投资自由化和便利化,推动金融稳定和改革,开展经济技术合作和能力建设等。近年来,APEC也开始介入一些与经济相关的其他议题,如人类安全(包括反恐、卫生和能源)、反腐败、备灾和文化合作等。 就目前状况来看,还有很长一段时间,亚太经合组织仍将处于调整阶段。区域内政治安全问题、区域内经济安全问题、区域与次区域之间的协调问题都是妨碍APEC发展的因素。 自从亚洲金融危机以来,危机的受害者开始对贸易投资自由化采取谨慎态度,在APEC内部,始于1997年的部门提前自由化在一定程度上超越了亚太地区的现实情况,难以按原有设想加以推进。经济技术合作得以保持发展势头,但因发达成员态度消极,要取得实质性进展仍需时日。1998年和1999年的两年,APEC进入一个巩固、徘徊和再摸索的调整阶段。亚太经合组织在发展中,也渐渐地暴露了一些问题。在削减关税问题上,发达国家和发展中国家的内部矛盾越来越明显。在接纳新成员问题上,关税低和关税高的成员持不同意见。在工作重点上,发展中国家强调经济技术合作,发达工业化国家却把重点依然集中在贸易投资自由化方面,为了自身利益,而不想为帮助发展中国家尽义务,对经济技术合作采取消极的态度。
中国加入亚太经合组织的意义 中国参与APEC进程,至少有以下四个方面的意义: (1)参与APEC进程,有利于中国把握全球经济合作的最新发展形势,因势利导地对中国的改革开放进程做出规划。APEC的目标是2010年/2020年发达成员和发展中成员分别实现贸易投资自由化和便利化,也就是最大限度地消除各种贸易壁垒。中国可以根据APEC的进程,结合自身的发展需要,持续推动改革开放事业。事实上,自参加APEC以来,中国已经在改善市场准入条件方面做出了很多承诺。1995年的大阪会议上,江泽民主席宣布中国将从1996年起大幅度降低进口关税税率的决定。过去几年中,中国做出了巨大的努力,已经数次降低了平均税率。到2001年,中国的进口商品平均关税已经下降到15%左右。 (2)参与APEC进程,有利于促进中国产品的出口,为中国企业创造一个更好的、更加稳定和开放的外部环境。自由化进程是没有例外的。市场的开放是相互的。现在中国的产品和企业的竞争力比过去已经有了很大的提高,国外市场的扩大,将会为中国的企业和产品提供更多的商机。 (3)参与APEC进程,有利于中国学习其他成员经济管理体制中的先进经验,完善自身的市场体制建设。中国虽然搞了这么多年市场经济建设,但还有很多方面不完善。APEC提供了一个与其他成员进行交流的场所,让中国了解和借鉴他们的先进经验。最近几年来,中国在政府采购制度、国际电子商务管理、海关程序等方面学到了很多东西,受益匪浅。 (4)参与APEC进程,有利于中国学习其他成员先进的科学技术。通过与APEC成员开展经济技术合作,中国可以加强与其他成员的交流与合作,及时把握和了解世界科技发展动态,提高中国的技术发展水平。 2001年10月21日,APEC第九次领导人非正式会议于2001年10月21日在上海落幕。APEC上海会议发表了《领导人宣言》、《上海共识》、《反恐声明》等一系列文件。以此APEC上海峰会是一次历史性的、里程碑式的会议。它所取得的进展将对APEC组织的未来、亚太区域政治与经济的未来发挥深远影响。 4.中国在APEC进程中的贡献 自加入APEC以来,中国积极参与APEC组织的各种活动。在促进本国经济发展的同时,也为APEC的发展做出了重要贡献。
中国—“亚太大家庭”的重要参与者 摘要 APEC是当今世界最大的区域经济合作论坛组织,在世界经济和区域经济的发展中发挥了举足轻重的作用。作为APEC的最大发展中成员,中国本着互利合作的原则,全面参与亚太活动,对亚太地区合作进程发挥了积极作用。当前,双方发展进程中机遇下蕴藏挑战。本文通过分析两者的关系,论述了APEC对中国经济生活带来的影响及相关的对策措施。 关键词:亚太经合组织合作互利共赢区域经济发展
目录 第一章绪论 (3) 1.1 亚太经合组织的形成 (3) 1.1.1亚太经合组织诞生的历史背景 (3) 1.1.2 亚太经合组织的基本状况 (3) 1.1.3亚太经合组织的特点与内容 (4) 1.2 中国与亚太经济合作组织 (4) 1.2.1 中国参与APEC的历史背景 (4) 1.2.2 中国加入APEC的过程 (5) 1.2.3中国与APEC成员的经贸关系简介 (5) 1.3 中国与亚太经合组织关系的讨论意义 (5) 第二章我国积极参与APEC的原因及重大意义 (5) 2.1 我国积极参与APEC的原因分析 (6) 2.2 中国参与APEC进程的意义 (8) 第三章新时期中国与亚太经合组织的发展状况 (5) 3.1 中国参与APEC经济技术合作的进展状况 (9) 3.2 APEC 对中国政治经济生活的影响 (9) 3.3中国在A P E C组织中的地位 (13) 3.4中国的主要主张及贡献 (13) 第四章中国与亚太经合组织发展的建议措施和未来展望 (15) 4.1政策建议和解决措施 (15) 4.2中国与亚太经合组织的发展前景 (17) 第五章结论 (18) 参考文献 (19)
亚太经合组织与中国 20世纪80年代以来,世界经济与政治格局发生变化,东欧剧变,前苏联解体,两极格局开始转变为多级格局。在经济全球化的压力下,许多国家寄希望于区域性的国际组织来加强本国的经济竞争力,使得区域经济一体化加速发展。 1989年11月5日至7日,澳大利亚、美国、加拿大、日本、韩国、新西兰和东盟6国在澳大利亚首都堪培拉成立亚太经济合作会议。1993年6月改名为亚太经济合作组织。到目前为止,亚太经合组织共有21个成员:澳大利亚、文莱、加拿大、智利、中国、中国香港、印度尼西亚、日本、韩国、马来西亚、墨西哥、新西兰、巴布亚新几内亚、秘鲁、菲律宾、俄罗斯、新加坡、中国台北、泰国、美国和越南。 作为一个区域性的国际经济组织,APEC成员国所讨论的议题主要都与全球及区域经济有关,如促进全球多边贸易体制,实施亚太地区贸易投资自由化和便利化,推动金融稳定和改革,开展经济技术合作和能力建设等。近年来,APEC也开始介入一些与经济无关的议题,比如人类安全问题(包括反恐、卫生和能源)、反腐败问题、备灾和文化合作等。在围绕亚太经济合作的基本方针所展开的讨论中,以下7个词出现的频率很高,它们是:开放、渐进、自愿、协商、发展、互利与共同利益,被称为反映APEC精神的7个关键词。 多年来,亚太经合组织在推动区域贸易投资便利化和自由化、加强区域经济合作、促进亚太地区经济合作和发展等方面都做出了许多突出的贡献:APEC成员支持“20国集团”(G20)匹兹堡峰会的共识,推动全球经济的均衡发展;美国总统奥巴马支持成立泛太平洋伙伴协议;APEC成员承诺加速经济统合,早日达成这项目标;APEC成员同意采取行动,简化复杂的海关程序及文件要求,方便区域内日益增加的贸易,并以在2015年以前,达成让贸易通关程序加快并降低费用25%为目标等。 自1991年11月中国正式以主权国家的身份加入了亚太经合组织,中国对外经济贸易稳步发展。中国对外贸易市场更加多元化,中国与亚太地区的国家贸易更加密切,中国过去的的三大贸易伙伴日本、美国、欧盟在中国对外贸易总额中所占的比重由2001年的48.03%下降到2007年的41.13%,而2010年1—6月,中国与东盟、韩国与印度的贸易总额占中国同期对外贸易总额的18.5%,多元化为中国对外贸易分散了风险。此外,中国大陆能够更好更多地吸引外资,2003年我国新批来自APEC成员的投资企业达34628家,实际利用外资金额390.2亿美元,分别占我国新批外资企业的84.3%和合同外资金额的72.9%。中国也能够更好地参与国际分工,更有效地利用资源。以劳动力为例,我国的劳动力拥有量居世界前列,但平均劳动力成本仍属于低水平。其他国家通过与我国开展加工贸易,分工协作,降低了生产成本,而我国也有效地利用了多余的劳动力,同时也带动了经济的发展,增加了贸易,提高了资本回报。 同时,中国也为APEC做出了重要贡献。为了应对席卷全球的国际金融危机,中国政府及时调整宏观经济政策,果断地实施扩大内需、促进经济增长等一揽子计划,积极与亚太经合组织的各成员国携手合作。2010年在新加坡举行的亚太经合组织第十七次领导人非正式会议上,胡锦涛主席宣布,中国政府将拨款1000万美元设立中国亚太经合组织合作基金,用于鼓励和支持中国相关部门和企业参与亚太经合组织经济技术合作。中国通过双边、多边和地区性合作等各种渠道,积极推动国际贸易新格局的构建,为构建公平、健全的国际贸易环境付出了应尽的责任。 随着近年来亚太经合组织的迅速发展壮大,一些问题也渐渐显现出来。 首先,APEC成员国众多,历史、文化、宗教的不同,政治和经济制度等地差异增加了APEC的隐患。成员国之间的经济体制与经济实力的差距等问题都会造成计划在制定与实施
《经济合作与发展组织电子商务消费者保护准则》概述 山西恒驰律师事务所迟菲 经济合作发展组织关于《经济合作与发展组织电子商务消费者保护准则》对电子商务领域消费者保护提出了保护的最基本要素及实现路径,提纲掣领的确定了电子商务中消费者保护的基本原则,对我国的电子商务消费者保护具有现实借鉴意义。本文对准则进行概述,希望能为研究这一领域的同仁提供一些帮助。 一、经合组织及准则出台的背景 (一)经合组织介绍 经济合作与发展组织(Organization for Economic Co-operation and Development),简称经合组织(OECD),是由34个市场经济国家组成的政府间国际经济组织,旨在共同应对全球化带来的经济、社会和政府治理等方面的挑战,并把握全球化带来的机遇。成立于1961年,目前成员国总数35个,总部设在巴黎。 经济合作与发展组织(OECD)的使命是推动改善世界经济与社会民生的政策。 OECD提供了一个平台,政府可以借此平台展开合作,分享经验并寻求共同问题的解决方案。OECD与政府合作,探究经济、社会和环境变化的推动力量。衡量生产力以及全球贸易和投资流。分析并比较数据以预测未来趋势。从农业和税收到化学制品安全性,对范围广泛的事务制定国际标准。与此同时,OECD也关注直接影响普通人生
活的各种问题。并从实际情况和现实经验出发,提出各种旨在改善民生的政策。 我国虽然目前尚未加入该组织,但该组织客观、开放、敢于挑战、不断开拓、恪守道德的核心价值观以及在此基础上做出的各项准则、规则、分析报告等对我国有巨大的现实参考意义。 (二)准则出台的背景 经合组织自上世纪90年代初及开始关注电子商务的发展,在1998年,该组织分析确定了电子商务具备一些特点,这些特点既能给消费者带来一些便利,同时也将消费者置于一个陌生的交易环境,使他们的权益无法得到保护。同时,电子商务促进经济全球化发展以及带给人类生活便利的同时,也存在这欺诈、误导及不公平竞争的问题。而且,现行法律在应对电子商务环境时,存在一些问题,使部分电子商务环境下消费者的保护低于一般的消费者保护。同时,电子商务使得跨境交易蓬勃发展的同时,各国消费者保护的政策、法律差异也给消费者保护带来不利影响。 因此,自1998年4月起,经合组织消费者政策委员会开始着手建立一些准则,希望能在不增加交易障碍的前提下为消费者在参与电子商务过程中提供保护。目的是为组织内及组织外的政府、企业、消费者及消费者代表阐明有效的电子商务消费者保护所需要的核心要素。准则并不直接约束成员国或为成员国设定义务。仅为成员国或非成员国提供一些辅助性的框架原则。准则并不限制各参与方及成员国政府采取更为严格的措施去保护线上消费者的权益。
亚太经济合作组织现状 近年来,在亚洲——太平洋地区,随着各国各地区经济相互依赖程度的不断增强,在冷战后世界经济一体化和区域集团化趋势日益明显的大背景下,亚太经济合作结束了自1964年日本学者小岛清首提亚太经合倡议以来二十多年的徘徊局面,亚太经济合作组织(Asia—Pacific Economic Cooperation,简称APEC)于1989年11月应运而生。几年来,APEC已经发展成为促进亚太地区贸易自由化和经济合作的重要工具。由于亚太地区政治、经济、宗教、文化的复杂性、多样性以及种种历史原因,使APEC呈现出不同于其他区域经济合作组织的特点。作为目前我国参与的唯一一个国际经济合作组织,APEC的特点和现状值得我们关注和研究。 一、APEC的特点 成员国的广泛性 亚太经合组织是当前规模最大的多边区域经济集团化组织,APEC成员国的广泛性是世界上其他经济组织所少有的。APEC的21个成员体,就地理位置来说,遍及北美、南美、东亚和大洋洲;就经济发展水平来说,既有发达的工业国家,又有发展中国家;就社会政治制度而言,既有资本主义国家,又有社会主义国家;就宗教信仰而言,既有基督教国家,又有佛教国家;就文化而言,既有西方文化,又有东方文化。成员的复杂多样性是APEC存在的基础,也是制定一切纲领所要优先考虑的前提。 独特的官方经济性质 APEC是一个区域性的官方经济论坛,在此合作模式下,不存在超越成员体主权的组织机构,成员体自然也无需向有关机构进行主权让渡。 坚持APEC官方论坛的性质,是符合亚太地区经济体社会政治经济体制多样性、文化传统多元性、利益关系复杂性的现实情况的。它的这种比较松散的"软"合作特征,很容易把成员体之间的共同点汇聚在一起,并抛开分歧和矛盾,来培养和创造相互信任及缓解或消除紧张关系,从而达到通过平等互利的经济合作,共同发展、共同繁荣,同时推动世界经济增长,以实现通过发展促和平的愿望。 开放性 APEC是一个开放的区域经济组织。APEC之所以坚持开放性,其中一个重要原因是APEC大多数成员体在经济发展过程中,采取以加工贸易或出口为导向的经济增长方式及发展战略。这样的发展战略所形成的贸易格局使这一地区对区外经济的依赖程度非常大,而采取开放的政策,不仅可以最大限度地发挥区域内贸易长处,同时也可以避免对区域外的歧视政策而缩小区域外的经济利益。除此之外,APEC成员体多样性,及其实行的单边自由化计划也客观要求它奉行"开放的地区主义"。 自愿性由于成员国之间政治经济上的巨大差异,在推动区域经济一体化和投资贸易自由化方面要想取得"协商一致"是非常困难的,APEC成立之初就决定了其决策程序的软约束力,是一种非制度化的安排。不具有硬性条件,只能在自愿经济合作的前提下,以公开对话为基础。各成员国根据各自经济发展水平、市场开放程度与承受能力对具体产业及部门的贸易和投资自由化进程自行作出灵活、有序的安排,并在符合其国内法规的前提下予以实施,这就是所谓的"单边自主行动(IAPs)"计划。 松散性 a.没有组织首脑。b.没有常设机构(各成员国轮流举办。2001年7月在中国上海举行非正式首脑会晤,这是自该组织成立以来首次在中国举办,这对让世