Theor Appl Genet(1998)96:147—154 Springer-Verlag1998
Ralph van Berloo·Piet Stam
Marker-assisted selection in autogamous RIL populations:
a simulation study
Received:5September1997/Accepted:6October1997
Abstract Molecular markers may enable plant breeders to select indirectly for genes a?ecting quantit-ative traits by selecting for molecular markers closely linked to these genes(marker-assisted selection,MAS). We have assessed the e?ectiveness of MAS compared to phenotypic selection.Key variables in this assess-ment were:trait heritability,selection intensity,genetic architecture and uncertainty in QTL mapping.Simula-tion studies showed that the application of MAS in autogamous crops,with the objective of obtaining transgressive genotypes,can improve selection results when compared to conventional selection procedures. Marker-assisted selection appears particularly promis-ing when dominant alleles at quantitative trait loci are present and linked in coupling phase.Uncertainty in estimated QTL map positions reduces the bene?ts of marker-assisted selection,but this reduction remains limited in most cases.
Key words Marker-assisted selection·Simulation·Quantitative trait loci·Complementation Introduction
The advent of molecular-marker techniques has had a large impact on quantitative genetics.Marker-based methods applied to segregating populations have provided us with a means to locate quantitative trait loci(QTLs)to chromosomal regions and to estimate Communicated by H.C.Becker
R.van Berloo()·P.Stam
C.T.de Wit Graduate school of Production Ecology, Department of Plant Breeding,Wageningen Agricultural University,PO box386,Wageningen,The Netherlands
Fax:#31317483457
E-mail:ralph.vanberloo@users.pv.wau.nl the e?ects of QTL allele substitution(Lander and Botstein1989).The ability to estimate gene e?ects and
locations for quantitative traits can be very useful for
the design and application of new,e?cient,breeding
strategies.A new selection strategy,marker-assisted
selection(MAS),has been proposed by many authors
as a way to increase gains from selection for quantitat-
ive traits(Tanksley1993;Lee1995;Kearsey and Pooni
1996).In backcross breeding programs,it has been
shown that MAS can be e?ective in reducing linkage
drag and optimising population sizes,by selecting
against the donor genome except for the allele(s)to be
introduced from the donor(e.g.Hospital et al.1992). MAS can also improve selection for quantitative
traits by selecting for the presence of speci?c marker
alleles that are linked to favourable QTL alleles.This
can be done for single marker loci or for an index
representing several marker loci.Breeding strategies
for autogamous crops are often aimed at obtaining
pure homozygous lines that show a superior pheno-
type.This can be done by generating genetic diversity,
for instance a segregating F population,selecting desirable individuals within the population,and then
repeatedly sel?ng and selecting individuals until
su?ciently homozygous lines are obtained.Another strategy uses the genetic variation that is present in
F -derived inbred lines,obtained without selection, commonly referred to as recombinant inbred lines or
RILs.
We consider a strategy based on intercrosses of pairs
of RILs.We assume that the aim of the selection is to
obtain single genotypes containing as many accumu-
lated advantageous alleles as possible.This goal is
di?erent from the aim of population improvement
studied by most other https://www.doczj.com/doc/067663054.html,nde and Thompson
(1990)and Gimelfarb and Lande(1994a,b),for example,
did not consider extreme genotypes within a MAS-derived segregating population,but focussed instead on improvement of the mean genotypic value of a population over several generations of selection.
In the present paper,we analyse the possible bene?ts
of MAS in autogamous crops,compared to conven-
tional phenotypic selection.We investigate how the
relative performance of MAS and conventional selec-
tion depend on the heritability of a trait,the intensity of
selection,the genetic architecture(e.g.the number and
spacing of markers,and the number and e?ects of
QTLs).
QTL mapping methods have continued to be im-proved since the earliest papers presenting and ap-
plying this approach(Soller and Brody1976;Lander
and Botstein1989).In particular the use of co-factors in
the analysis to account for multiple segregating QTLs
can considerably reduce the size of QTL support inter-
vals on the genome(Jansen and Stam1994).Neverthe-
less,uncertainty in estimates of QTL map locations
and e?ects are unavoidable.We were interested to see
how the performance of MAS is in?uenced by errors in
the estimation of QTL locations and e?ects.
Our selection material consists of a set of RILs,
obtained through single-seed descent from a cross be-tween two homozygous parents,markers having been
mapped and QTLs supposedly mapped in the F gen-eration,allowing estimation of dominance e?ects.RILs
are assumed to be completely homozygous.The prob-
lem we address is:which pair of RILs from this set is
most promising in producing extreme genotypes
among their o?spring?We de?ne extreme genotypes as
those that contain the favourable allele at(nearly)all
QTLs detected for the trait of interest.The perfor-
mance of a pair of RILs is evaluated by considering the
simulated F o?spring obtained by crossing these RILs (see below for details).
In an average-sized population of RILs it is impracti-
cable to cross and test all possible pairs of lines.Thus
we wish to predict,before any RILs are crossed,which
pairs are most likely to produce the most extreme
genotypes in the F ,accumulating as many as possible advantageous alleles in a single genotype.
Materials and methods
In MAS,predictions for the performance of the o?spring of line-pairs are used.These predictions are based on an index constructed from the genotypes of markers?anking putative QTLs in the pair of lines.In conventional selection,a line’s phenotype determines if that line becomes part of a subset of selected lines.From this subset all possible pairs of lines are selected.
Marker index construction
The marker index value is calculated as an index for possible line combinations,based on the marker genotype of the potential F
resulting from crossing two parental lines.Since the indices are connected to line pairs,a population of N lines results in
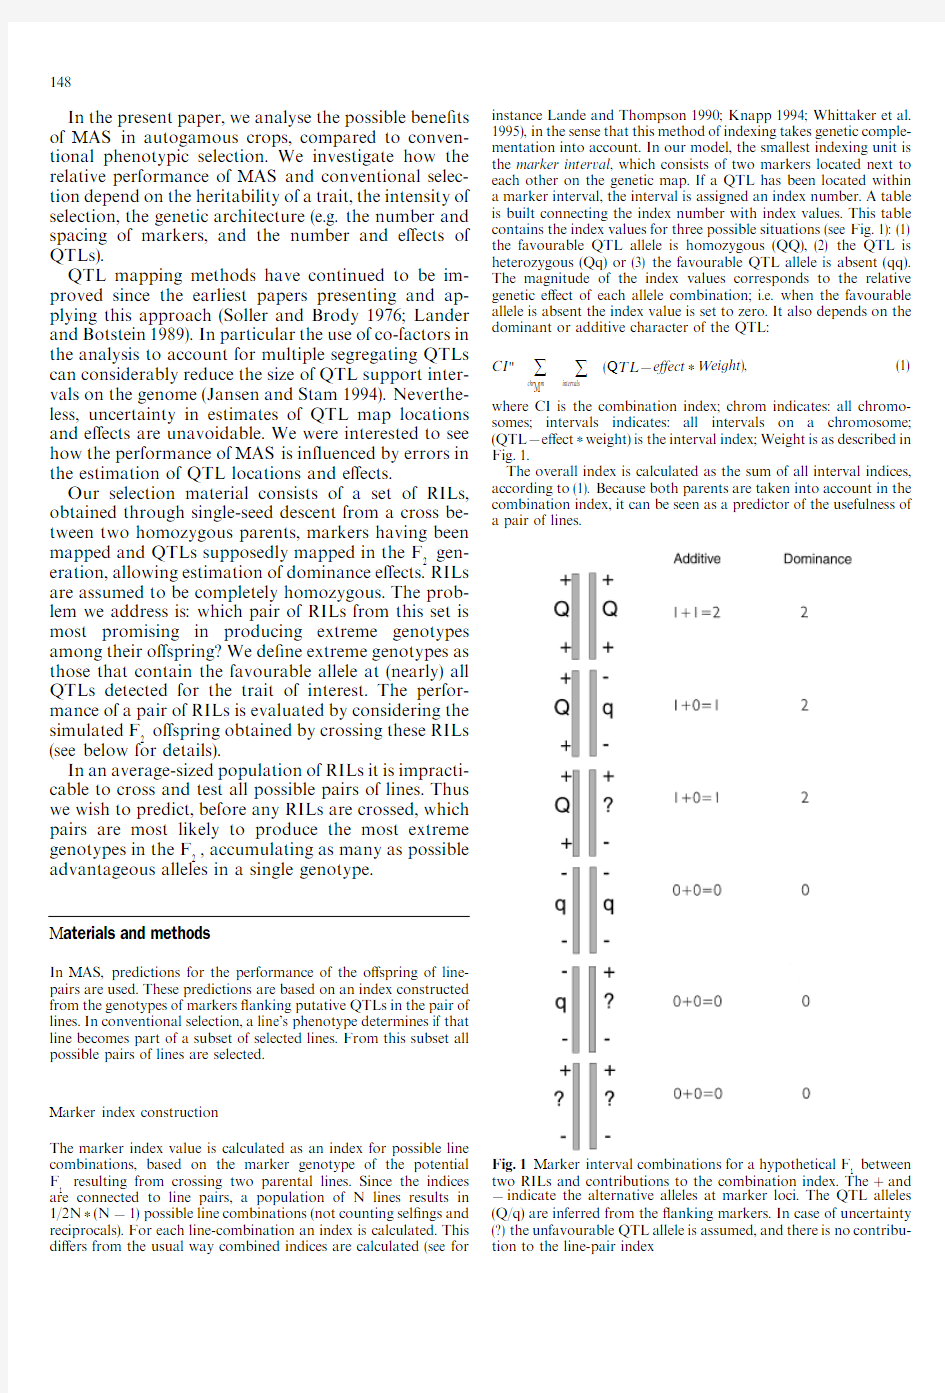
1/2N*(N!1)possible line combinations(not counting sel?ngs and reciprocals).For each line-combination an index is calculated.This di?ers from the usual way combined indices are calculated(see for instance Lande and Thompson1990;Knapp1994;Whittaker et al. 1995),in the sense that this method of indexing takes genetic comple-mentation into account.In our model,the smallest indexing unit is the marker interval,which consists of two markers located next to each other on the genetic map.If a QTL has been located within a marker interval,the interval is assigned an index number.A table is built connecting the index number with index values.This table contains the index values for three possible situations(see Fig.1):(1) the favourable QTL allele is homozygous(QQ),(2)the QTL is heterozygous(Qq)or(3)the favourable QTL allele is absent(qq). The magnitude of the index values corresponds to the relative genetic e?ect of each allele combination;i.e.when the favourable allele is absent the index value is set to zero.It also depends on the dominant or additive character of the QTL:
CI"
AFPMK
GLRCPT?JQ
(Q1?!e?ect*?eight),(1)
where CI is the combination index;chrom indicates:all chromo-somes;intervals indicates:all intervals on a chromosome; (QTL!e?ect*weight)is the interval index;Weight is as described in Fig.1.
The overall index is calculated as the sum of all interval indices, according to(1).Because both parents are taken into account in the combination index,it can be seen as a predictor of the usefulness of a pair of
lines.
Fig.1Marker interval combinations for a hypothetical F between two RILs and contributions to the combination index.The#and !indicate the alternative alleles at marker loci.The QTL alleles (Q/q)are inferred from the?anking markers.In case of uncertainty (?)the unfavourable QTL allele is assumed,and there is no contribu-tion to the line-pair index
148
Phenotype
The phenotypic value for a recombinant inbred line was calculated by adding an environmental error term,drawn from a normal
distribution with mean "0and variance "V#to the line genotypic value.The line genotypic value was determined by the
genotype at all QTLs,assuming additivity between QTLs.The magnitude of V#depends on the trait heritability.Genetic variance V%was calculated from the RIL genotypes;environmental variance V#was calculated according to(2),derived directly from the de?ni-tion of heritability:
V#"[(1—h )/h ]V%,(2) where V%is the genotypic variance,V#is the environmental(error) variance and h is the broad-sense heritability.
Simulations
Simulation consisted of the following steps.
(1)Two complementary parents,de?ning the genetic architecture, were used to generate a set of100RILs.The genotype and pheno-type of these RILs was calculated.Most simulation runs involved three replications,for each replication a di?erent set of RILs was raised.
(2)For each RIL population marker indices were calculated for all RIL pairs.Based on the combination indices a subset of all RIL pairs was selected for evaluation(MAS,Fig.2A).The size of this subset is called the‘selected fraction’.
(3)Another subset of RIL pairs was selected based on the pheno-type of the RILs(phenotypic selection,Fig.2B).Among the lines, RILs with the highest phenotype were selected and a set of line pairs between the selected RILs was created.The number of lines that was selected was chosen in such a way that the total number of line pairs in this second set was equal to the number in the set selected with MAS.
(4)For each selected RIL pair the F generation was raised and subsequently selfed to obtain a segregating F population of size 1000.For each generated F population the average and standard deviation of the genotype was calculated.For the estimation of population extremes the F progeny was divided into ten random groups of100progeny each.The most extreme genotype from each group was recorded and the average over the ten group-extremes was taken as the value for the extreme genotype of the population.In this way we actually obtained an estimate of the extreme genotypic value in an F population of size100,which is attainable in most practical situations.
(5)The selection response was used to assess the success of each selected pair of RILs.The selection response was de?ned as the di?erence between the average extreme genotypic value(G )and the average genotype of all RILs(G0'*),divided by G0'*to obtain a relative number.This can be written as:G0'*"( g )/N and: selection response"100*(G !G0'*)/G0'*;where the RIL popu-lation consists of N RILs and the genotype of the i RIL is denoted as g .When the procedure was repeated over several RIL-sets the average selection response was used to assess the success of the selection method.
(6)The selection response obtained using MAS was compared to the selection response after phenotypic selection.
We now describe the speci?c simulation conditions used to inves-tigate the in?uences of trait heritability,selection intensity,several aspects of genetic architecture,and uncertainty in QTL locations on the performance of MAS,compared to phenotypic selection.The relevant simulation parameters are:The number of markers,the QTL positions and e?ects as well as the type of inheritance and linkage between QTLs,the trait heritability,and the fraction of RIL pairs that was selected.Except when stated otherwise,we assume that the mapped positions of markers and QTLs are accurate,
no Fig.2Comparison of marker-assisted selection procedure(A),with conventional phenotypic selection procedure(B).With MAS speci?c line combinations are selected,while with conventional selection lines are selected?rst and then combined with each other interaction occurs between QTLs,and no interference is present during meiosis.The heritability is only used to estimate the magni-tude of the environmental error.We assume that the heritability is determined accurately in a trial of su?cient size.
Trait heritability
Four RIL populations were generated and used for simulation. Simulations were run for genomes containing?ve identical chromo-somes.Nine markers were positioned at10-centiMorgan(cM)inter-vals on each chromosome.Two QTLs per chromosome were located at positions20and80,replacing the markers at these positions.The QTLs were linked in coupling phase.All QTLs had the same size e?ect,and there was no additive interaction between QTLs.We only considered additive e?ects of allele substitution at each QTL.The fraction of pairs that was selected was10%.We studied trait heri-tabilities ranging from h "0.1to h "0.9.
Selected fraction
As stated earlier,it is ordinarily not feasible,to test all possible line combinations in a set of RILs.For this reason we assessed the
149
amount of useful material that is lost by decreasing the number of selected RIL https://www.doczj.com/doc/067663054.html,ing the same con?guration as for investigating heritability,we varied the fraction of RIL pairs selected,ranging from5%to50%,and recorded the selection response.Heritability was held constant at0.1and QTLs were linked in coupling phase. Only additive QTL allele e?ects were considered.
Number of chromosomes,dominance,linkage phase
We investigated the e?ects of di?erent QTL con?gurations.For a genome consisting of5,10or20chromosomes,we compared the selection response obtained with MAS to the selection response obtained when conventional selection was applied.Nine markers were positioned at10-cM intervals on each chromosome.Two QTLs per chromosome were located at positions30and70for the genomes consisting of?ve and ten chromosomes,replacing the markers at these positions.One QTL per chromosome was located at position35 for the genome consisting of20chromosomes.QTL alleles were linked in either coupling phase or repulsion phase.QTL allele e?ects were either additive or showed complete dominance.The e?ects of all QTLs were of the same magnitude.Heritability of the trait was held constant at0.1and the selected fraction of RIL pairs was10%. Random QTL dispersion and geometric allele e?ects
We also tested the genetic con?guration used by Gimelfarb and Lande(1994a;Fig.1).In this setting25QTLs are dispersed randomly over ten chromosomes of length100.The e?ects of the QTL alleles constitute the‘geometric series of variance contributions’as described by Lande and Thompson(1990).(Among the25QTLs there were only a few with a large e?ect and there were many QTLs with a small e?ect).It is believed that such a constitution gives a better representa-tion of a naturally occurring situation.We tested this setting with QTLs linked in repulsion and coupling phases.The Gimelfarb and Lande genome has marker loci at every10cM:110marker loci in total.We also tested the e?ect of marker loci present every20cM, resulting in a map with60markers in total.The selected fraction of RIL pairs was10%.Trait heritability was held at0.1or0.3. Errors in QTL mapping
To study the e?ect of uncertainty in QTL number and position we have run simulations for the following situations:
Q1?s mapped to incorrect marker intervals
It is assumed that the mapped positions of some QTLs does not correspond to their true positions on the genome.Instead these QTLs are mapped to intervals adjacent to the intervals containing the true positions,leading to the selection of some incorrect marker intervals in the MAS procedure.We tested a con?guration with ten chromosomes,carrying20QTLs with equal e?ects linked in coup-ling phase.Nine markers per chromosome were present at10-cM intervals.Two QTLs per chromosome were present at locations30 and70,replacing the markers at these positions.All QTL e?ects were additive.Trait heritability was held at0.1and the selected fraction of RIL pairs was10%.The proportion of QTLs that were not assigned to their true marker interval,but rather to a neighbour interval,ranged from5%to100%.
ondetected Q1?s(1ype-II errors)
Here we allow that the QTL mapping procedure may fail to locate one or more QTLs,causing reduced selection opportunities for MAS.The same con?guration was used as described in the section dealing with QTLs mapped to incorrect intervals,but a randomly chosen subset of the QTLs present in the simulated cross were not used for marker-interval indexing.We ran simulations for the cases where0%,25%,50%or75%of the QTLs were not included in the computation of indices.
False positive Q1?detection(1ype-I errors)
The QTL mapping procedure may falsely indicate the presence of one or more QTLs at positions where none in fact exist.These‘false QTLs’were used for interval indexing,introducing errors in the overall combination index.Again the same con?guration as in the situation of QTLs mapped to adjacent intervals was used.Twenty true QTLs were present,but the number of QTLs used for comput-ing indices ranged from20to40.The‘false QTLs’were added to the genome randomly,but as a constraint no more then four QTLs could be present per chromosome and only one QTL was allowed per marker interval.
Software
A simulation computer program,mimicking Mendelian genetical behaviour,has been created to enable crossing and selection. The smallest model unit,the locus,can be either a marker or a quantitative trait locus.Loci are linked together in linkage groups or chromosomes and Mendelian rules apply to the simulation of recombination during meiosis.QTLs and allele e?ects remain vis-ible,but are not used for selection.Selection is based only on marker loci and intervals of marker loci.Within the model,indices are calculated for pairs of lines.Based on these index values,pairs of lines are either selected or disregarded from the selected fraction.In conventional selection,phenotypic values are used as the criterion to select RIL pairs.The software was written in Borland Delphi and run on a Pentium PC.
Results
Trait heritability
The results of this experiment are summarised in Fig.3. With additive QTL e?ects,MAS resulted in a higher selection response at heritabilities0.1and0.3,while for a heritability of0.5the advantage of MAS over phenotypic selection becomes negligible.At trait heri-tability approaching1.0we can see that the phenotypic selection response becomes larger than the selection response after MAS.This observation is probably due to the conservative way index selection is practised.If only one of two markers?anking a QTL is present,no index value is awarded,because it is uncertain which QTL allele is present.In approximately half of the cases this will be the advantageous allele,but in the other half it will be the other,undesirable,allele.In this way some of the advantageous alleles are missed by MAS,so reducing it’s power.
The software described in this paper can be obtained from the author.
150
Table1Relative selection responses in conventional phenotypic selection(CS)and marker-assisted selection(MAS)for di?erent genetic con?gurations,types of inheritance and linkage conditions. The data shown are averaged over three di?erent RIL sets.The genome consisted of chromosomes of length100-cM with evenly spaced markers at10-cM intervals.The con?guration containing20chromosomes contained only one QTL per chromosome,at45-cM. All other con?gurations contained the QTLs per chromosome located at35and75cM linked in coupling phase or repulsion phase. QTL e?ects were of equal size for all QTLs.Trait heritability was ?xed at0.1and the selected fraction of RIL pairs was10%
Type5chrom,10QTLs10chrom,20QTLs20chrom,
20QTLs
Coupling Repulsion Coupling Repulsion
Additive CS32%34%27%23%34% MAS52%47%42%32%44% Dominant CS59%56%51%48%33% MAS84%72%68%58%45%
The selection response was calculated as:100*(G !G0'*)/G0'*, where G is the average of the realised extreme genotypes of the F progenies resulting from the selected RIL pairs,and G0'*is the average RIL genotypic value
Random QTL dispersion and geometric allele e?ects The selection response for MAS and phenotypic selec-tion for the data set derived from the Gimelfarb and Lande(1994a)map are summarised in Table2.Again we see that MAS results in a higher selection response compared to phenotypic selection.When the number of marker loci is reduced from110to60(the interval size is increased from10cM to20cM),the frequency of having more than one QTL within a marker interval increases.This results in a reduction of the selection response for MAS,especially when QTLs are linked in repulsion phase,because the overall e?ect of the marker interval will become small when neighbouring QTLs within a marker interval partly counterbalance each others e?ect.
Errors in QTL mapping
Q1?s mapped to incorrect marker intervals
The performance of MAS is a?ected when QTLs are not mapped at their true position.The magnitude of this e?ect can be seen in Fig.5.A reduction in selection response was observed as the number of incorrectly located QTLs increased,but the e?ect was small.We believe this is because using a neighbouring marker interval for calculation of the index will in most cases still result in the same index.Only when recombination has occurred within either or both of the correct and incorrect intervals will the resulting index be a?ected, and thus the performance of a RIL pair be inaccurately predicted.
ondetected Q1?s(1ype-II errors)
QTLs that have an in?uence on the phenotype are not always detected at the mapping stage.As a result,these Table2Relative selection responses in conventional phenotypic selection(CS)and marker-assisted selection(MAS)for di?erent heritabilities and marker spacings in the case of random dispersed QTLs and geometric QTL e?ects.The data presented are averaged over three di?erent RIL sets.The genome consisted of ten chrom-somes of length100cM with evenly spaced markers at10-cM or20-cM intervals.The distribution of QTLs and their e?ects were as speci?ed by Gimelfarb and Lande(1994a).QTL e?ects were assumed additive.Linkage between QTLs on the same chromosome was either in coupling phase or in repulsion phase.Trait heritability was kept at0.1or0.3.The selected fraction of RIL pairs was10%
Coupling Repulsion
10cM20cM10cM20cM h "0.10CS27%27%20%20%
MAS51%49%27%23%
h "0.30CS33%33%22%22%
MAS51%49%27%23% The selection response was calculated as described in Table1
QTLs can not be selected by the MAS procedure.The size of the reduction in selection response caused by undetected QTLs is shown in Fig.6.A reduction in selection response was observed as the proportion of undetected QTLs increased.However,even when only 25%of the QTLs are mapped and indexed the selection response obtained after applying marker-assisted selec-tion is still4%larger than the response after applying phenotypic selection.This indicates that(for low heri-tability traits)it is worthwhile to pursue marker-assist-ed selection,even if the phenotypic data did not allow the detection of all QTLs.
False positive Q1?detection(1ype-I errors)
The introduction of false QTLs—QTLs that are not actually present genetically,but were identi?ed by the QTL mapping procedure—showed no e?ect on the
152
Discussion
We have assumed that a set of RILs obtained from a given cross,well characterised in terms of marker genotypes and QTL positions,is available as a starting point for further crossing and selection.
We have not focussed on population improvement by MAS but rather on the‘breeding behaviour’of pairs of RILs.The results indicate that marker data can be a valuable extra source of information on which to base selection,especially when heritability is low.Marker information appears to add little to phenotypic information at high heritability,but at low heritability it does so.This is in agreement with results on recurrent MAS for population improvement(Lande and Thomp-son1990;Gimelfarb and Lande1994a,b;Gallais &Charcosset1994).
In all simulations we have assumed that all QTLs a?ect a single trait.This is,of course,a simpli?cation but not a limitation;one can easily imagine the case where the QTLs of the model are divided into subsets, each set a?ecting a di?erent trait.The‘?nal trait’could then be an index value,composed of a linear combina-
a future generation.This may facilitate breeding for several traits simultaneously.In future more and more marker and QTL information will be collected;also existing breeding populations will be screened for markers and QTLs.An e?cient way to use this information and to predict useful crosses would require prediction and selection procedures similar to those described in this paper.
Acknowledgements We like to thank Dr.Scott Chasalow for helpful comments and discussions.
References
Gallais A,Charcosset A(1994)E?ciency of marker-assisted selec-tion.In:van Ooijen JW,Jansen,J(eds)Biometrics in plant breeding:applications of molecular markers.CPRO-DLO, Wageningen,pp91—98
Gimelfarb A,Lande R(1994a)Simulation of marker-assisted selec-tion in hybrid populations.Genet Res63:39—47
Gimelfarb A,Lande R(1994b)Simulation of marker-assisted selec-tion for non-additive traits.Genet Res64:127—36Hospital F,Chevalet C,Mulsant P(1992)Using markers in gene introgression breeding programs.Genetics132:1199—1210 Jansen R,Stam P(1994)High resolution of quantitative traits into multiple loci via interval mapping.Genetics136:1447—1455 Kearsey MJ,Pooni HS(1996)The genetical analysis of quantitative traits.Chapman and Hall,London
Knapp SJ(1994)Selection using molecular marker indexes.In:Proc 2nd Plant Breed Symp Crop Sci Am and Am Soc Hort Sci, Corvallis,Oregon,pp1—11
Lande R,Thompson R(1990)E?ciency of marker-assisted selection in the improvement of quantitative traits.Genetics124:743—756 Lander ES,Botstein D(1989)Mapping Mendelian factors underly-ing quantitative traits using RFLP linkage maps.Genetics 121:185—199
Lee M(1995)DNA markers in plant breeding programs.Adv Agron 55:265—344
Soller M,Brody T(1976)On the power of experimental designs for the detection of linkage between marker loci and quantitative loci in crosses between inbred lines.Theor Appl Genet47:35—39 Tanksley SD(1993)Mapping polygenes.Annu Rev Genet 27:205—233
Whittaker JC,Curnow RN,Haley CS Thompson R(1995)Using marker-maps in marker-assisted selection.Genet Res66: 255—265
154