NEEDLE INSERTION FORCE MODEL FOR HAPTIC SIMULATION
Adam Gordon
Dept. of Mechanical Engineering The Pennsylvania State University University Park, PA, USA
Inki Kim
Dept. of Industrial Engineering The Pennsylvania State University University Park, PA, USA
Andrew C. Barnett Dept. of Mechanical Engineering The Pennsylvania State University University Park, PA, USA
Jason Z. Moore
Dept. of Mechanical Engineering The Pennsylvania State University University Park, PA, USA
KEYWORDS
Needle Insertion, Tissue Cutting
ABSTRACT
Percutaneous medical procedures rely upon clinicians performing precise needle insertion in soft tissue. The utility of haptic simulation systems in training clinicians for these procedures is highly dependent upon the ability to render accurate insertion force feedback. This paper presents a piecewise mathematical model for insertion force that does not require tissue material properties, detailed mechanical approximations, or complex computations. With manipulation of model parameters, a wide variety of insertion tasks and clinical scenarios can be modeled. Through needle insertion experiments and parameter estimation, this model was demonstrated to replicate the insertion forces associated with a variety of needle and tissue types. In 11 of 12 needle and tissue combinations tested, the model replicated the insertion force with an average absolute mean error of less than 0.065 N.
INTRODUCTION
Central Venous Catheter insertions are performed over 5 million times per year in the United States [1]. While these procedures deliver essential medical care, mechanical complications, including arterial puncture, hematoma, and pneumothorax, have been reported at rates ranging from 5% to 21%. [1-3]. The occurrence of such complications has been correlated directly to clinician experience and training methodology, highlighting the need for medical simulation technology [2, 3]. In addition to Central Venous Catheter insertions, many percutaneous procedures exist that rely upon accurate placement of surgical needles, including tissue biopsy, brachytherapy, ablation, and lumbar puncture [4, 5]. Given that physicians rely heavily upon haptic perception to guide these needle insertions, accurate force feedback is a key element in computer based simulation systems [6]. To provide this feedback, a model for needle insertion force into soft tissues is required.
Modeling the force interactions during needle insertion into biological tissue has been a focus not just for medical simulation, but also for robotic surgery and preoperative planning [7]. Finite Element Methods (FEM) have been the focus of many works for modeling needle insertions and resulting tissue deformations. A common strategy has been to create a mesh framework representative of tissue, some works also adding a distinct mesh for the needle, with needle interaction forces simulated by boundary conditions applied to appropriate nodes [8-12]. Recent studies have also explored using advanced forms of FEM to more accurately simulate the needle insertion fracture mechanisms [13, 14]. Although it is a common simulation technique, there are major challenges associated with FEM. First, implementing accurate tissue constitutive equations is extremely difficult, as real tissue exhibits nonlinear and viscoelastic behavior [15]. While some models have incorporated a form of nonlinearity or viscoelasticity [13, 16-18], many instead approximate the tissue as linear elastic material [8-10, 14]. Due to large material deformations in certain clinical scenarios, these approximations are not always appropriate [17]. Second, FEM techniques for needle insertion have been widely acknowledged to have costly computational demand, sometimes inhibiting real-time simulation. For this reason, a significant focus of recent research has been on improving the computational efficiency of these methods [16, 18-20]. Lastly, model accuracy in FEM requires accurate estimation of tissue mechanical properties. These
Proceedings of the ASME 2015 International Manufacturing Science and Engineering Conference
MSEC2015
June 8-12, 2015, Charlotte, North Carolina, USA
MSEC2015-9352
estimations are challenging due to patient variability, biological variation in testing conditions, and tissue inhomogeneity [21, 22]. Many FEM models simplify this problem by assuming homogenous properties for regions of the same tissue type [10-14]. This comes at the expense of losing some of the inherent variability in insertion forces, such as those caused by anatomical substructures like vasculature, which have been shown to cause large peaks in insertion force [23].
In addition to FEM, there is a range of other models developed for needle insertion forces, several of which were developed with the potential to be implemented alongside FEM.
A key model cited in many works divides the needle force into three sub-forces applied in a piecewise fashion: tissue stiffness, friction, and cutting. Stiffness force is modeled according to a second order polynomial, friction force is modeled by a Karnopp model, and cutting force is a constant [7]. In a similar model, this was extended to multiple layers of tissue with function parameters specific to each layer [24]. Within the realm of these schemes, the modeling of friction sub-force has been its own concentration of recent research [25, 26]. A notable limitation in this three force method is the absence of collisions with small internal structures that lie within a tissue layer and may influence insertion force [7].
To simplify the relationship between needle penetration depth and force, Hookean spring models have been another common theme in insertion force modeling. To simulate the needle passing through different tissue types, the spring constant varies for each tissue layer. Transitions between layers may be incorporated with empirical modifications to the overall force [27-29]. In some models, a linear viscous damping is also substituted for the fat layers. It is important to once again note that Hookean relationships are accurate for tissue only if small deformations occur in each layer, which is not always the case in a clinical situation [29]. In a more advanced form of the above layer modeling, a series of Voigt elements is used to capture some of these nonlinearities [30].
Online estimation in combination with a parameterized needle insertion model is a more complex method of mathematically modeling forces. In one instance, parameters were used that varied with time. This is impractical for force simulation applications, as parameters will have more data points associated with them than an original force data set [31]. Similar work utilized steady state convergence parameter values [4]. Another mathematical approach used a radial basis function network to form a non-linear approximation of insertion force [32]. Both of these approaches have yet to be demonstrated on real, inhomogeneous tissue.
In systems with advanced graphic renderings, insertion forces have been simulated using proxy-based algorithms. In general, proxies are assigned based upon the positions of graphical objects in the simulation, and the simulated needle tip position is virtually coupled to a proxy using a damper-spring combination. The force within this coupling dictates the force output of the simulation, and when it exceeds a given threshold, surfaces, such as an organ capsule, may be penetrated [33]. Parameter constants are assigned to each proxy coupling based upon the material properties of the graphical object interacting with the needle [34].
Other studies have focused on modeling the distribution of force over the length of the needle, with total insertion force coming from the integration of this distribution. The parameterization of these distributions is also dependent on approximating individual tissue as linear elastic material with uniform properties [35, 36].
In this paper, a modeling system for needle insertion force simulation is presented in which forces are parameterized according to a piecewise mathematical function. Through parameter manipulation, this model can replicate axial insertion force as a function of needle depth for a variety of insertion tasks. Within a given task, this manipulation also enables simulation of the high clinical variability in forces, which has been identified as a crucial element in clinician training [37]. Unlike the common existing models, this method, combined with a simple parameter fitting scheme, does not rely upon complex computation, determination of material properties, or detailed mechanical approximations.
Through a series of needle insertion experiments, the applicability of this model to several tissue types and needle geometries will be demonstrated and analyzed. First, the model function and the associated parameter fitting algorithm will be described. Second, the experimental procedure for measuring insertion forces and obtaining model parameters will be outlined. Third, the ability of the model to replicate the experimentally measured forces will be analyzed and discussed. Finally, conclusions from this work and directions of future study will be presented.
TISSUE INSERTION FORCE MODEL
Overview of Model
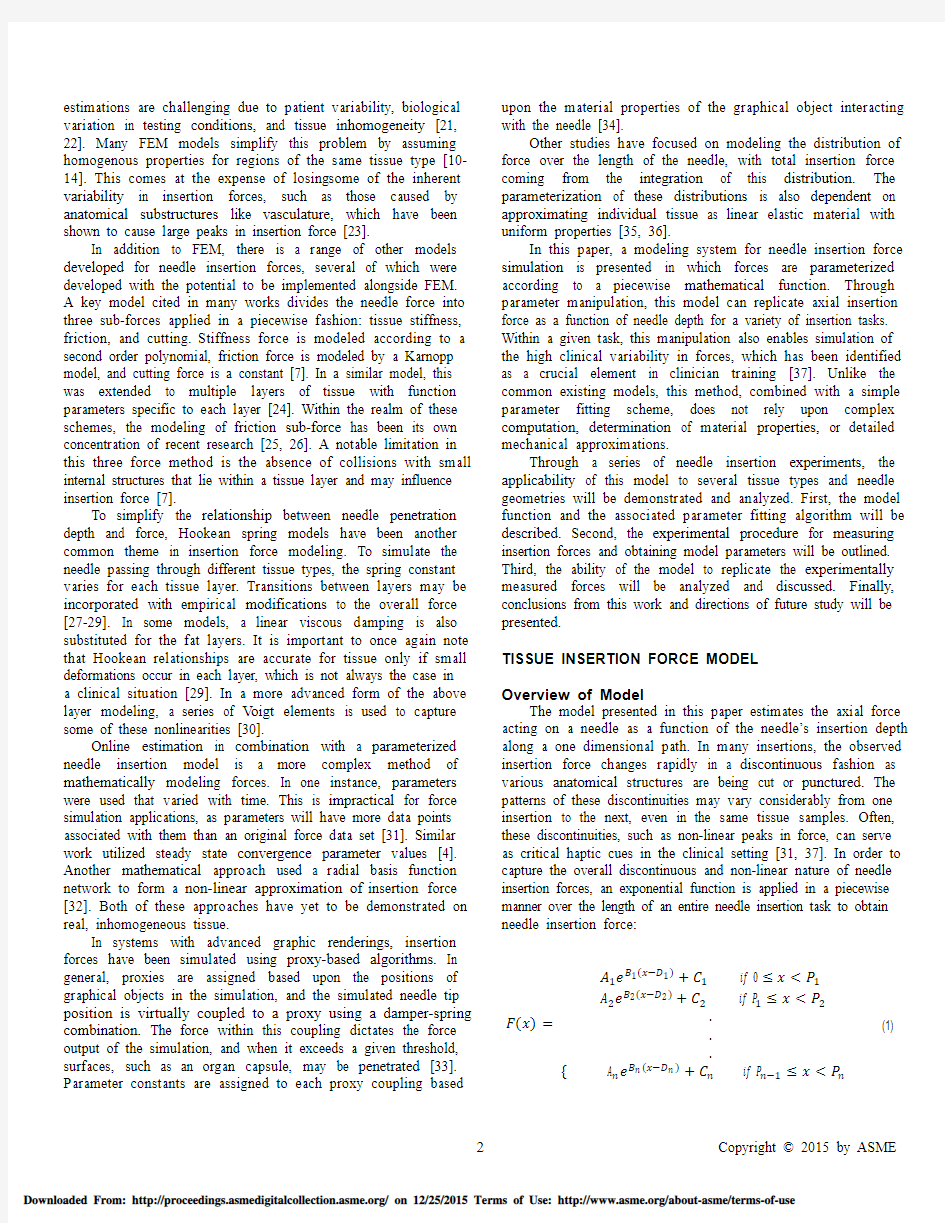
The model presented in this paper estimates the axial force acting on a needle as a function of the needle’s insertion depth along a one dimensional path. In many insertions, the observed insertion force changes rapidly in a discontinuous fashion as various anatomical structures are being cut or punctured. The patterns of these discontinuities may vary considerably from one insertion to the next, even in the same tissue samples. Often, these discontinuities, such as non-linear peaks in force, can serve as critical haptic cues in the clinical setting [31, 37]. In order to capture the overall discontinuous and non-linear nature of needle insertion forces, an exponential function is applied in a piecewise manner over the length of an entire needle insertion task to obtain needle insertion force:
F(x)=
{
A1e B1(x?D1)+C1 if 0≤x A2e B2(x?D2)+C2 if P1≤x . . . A n e B n(x?D n)+ C n if P n?1≤x (1) Here, F is the insertion force as a function of needle insertion depth x, where x is zero when the needle first contacts tissue. A n, B n, C n, and D n parameterize the force at each piecewise segment n. The critical depth at which each piecewise phase terminates is denoted by P n. In modeling force as a function of solely depth, the assumption of a constant, given insertion velocity is made for simplicity. Future work may study the velocity dependence of model parameters. In addition, the one dimensional nature of the model makes it appropriate only for simulations in which three dimensional needle manipulation for steering is not required. Model Parameter Estimation To obtain the model parameters for a real insertion task, a MATLAB based algorithm is implemented. As shown in Figure 1, this algorithm is highly effective in obtaining parameters for a variety of tissue types with starkly contrasting insertion force profiles. With measured force versus depth data input into the MATLAB program, a user is able to graphically segment the data into piecewise regions using data markers. These markers provide the initial set of P parameters. For this study, segmentation occurs wherever the global trend of the force has an abrupt discontinuity, as marked by red circles in Figure 1. With the data segmented, a non-linear least squares method is used to fit the exponential function individually to each phase. Next, the intersection positions of resulting phase functions are calculated using a built-in MATLAB solver. The critical depths, P n, are then redefined as these intersection positions. This ensures that the overall force model does not have any abrupt jumps between piecewise phases. The final parameters for each phase are then output by the program and can be used to model the insertion force, as is done in Figure 1. Once markers are initially placed, the parameter estimation process typically takes less than 10 seconds on a standard PC. EXPERIMENTAL SETUP FOR FORCE MEASUREMENT AND PARAMETER ESTIMATION Needle Insertion Experimental Setup The laboratory setup shown in Figure 2 was utilized to acquire insertion force as a function of insertion depth in tissue samples. A linear actuator (Dunkermotoren) drove the needle into samples at a controlled constant velocity. To measure insertion force, a six-axis load cell (ATI) was coupled to the base of the needle. A LabView interface and data acquisition system (National Instruments, PXIe-6361) operated the actuator and recorded data. Needle insertions were performed on four different tissue types: bovine liver, porcine skin, homogeneous phantom gel (M.F. Manufacturing Company), and a catheter insertion training mannequin (CAE Healthcare, BPH 660 Series). The phantom gel was made of polyvinyl chloride modified with plastisol and formulated with a 5:1 plastic to softener ratio. This gel has been commonly used as a soft tissue simulant for needle insertion experiments [38, 39]. The CAE Healthcare mannequin is a popular catheter insertion training tool that replicates relevant anatomical features, including an artificial artery and vein, surrounded by synthetic material. While the artificial tissues did not require any fixture for the insertion, specialized fixtures were employed to constrain the biological tissues. As shown in Figure 2, the bovine liver sample was placed in a plastic prism with slots on either side to allow needle insertion. To prevent movement within the prism, the top plate applied a constant pressure of 25 psi through a pneumatic pump. For the porcine skin, two aluminum plates clamped the tissue, allowing only local deformations in the regions of uniformly-distributed insertion holes. FIGURE 1—MEASURED INSERTION FORCE AND MODELED INSERTION FORCE FOR 18 GAUGE CONVENTIONAL HYPODERMIC INSERTION THROUGH PORCINE SKIN (A) AND 18 GAUGE BRACHYTHERAPY NEEDLE INSERTION INTO BOVINE LIVER (B); SEGMENTATION POINTS MARKED WITH RED CIRCLES FIGURE 4—ABOLUTE MEAN ERROR FOR MODEL OVER ENTIRE INSERTION AVERAGED BY NEEDLE AND TISSUE TYPE; +/- 1 STANDARD DEVIATION AMONG TRIALS IS SHOWN BY ERROR BARS Experimental Design The combinations of needles and tissues tested are shown in Table 1, with five trials performed for each combination. Insertion velocity was held constant across all tests at 8 mm/s, a velocity within the range for clinical procedures [40]. Images of the needles utilized in experiments and their bevel geometries are shown in Figure 3. Following experimentation, insertion force data sets were input into the MATLAB algorithm to obtain model parameters for individual trials. The mannequin was tested in two configurations: with and without an add-on layer that simulates patients with excess fat tissue. TABLE 1—CLINICAL NEEDLES AND TISSUE TESTED RESULTS AND DISCUSSION Model Outcomes and Accuracy The parameters found for each trial were applied to the insertion force model and used to obtain model-predicted force values at each depth for individual trials. The absolute mean error over the course of an entire insertion trial was obtained by comparing the modeled force with measured force at each depth. The absolute mean error of trials for the same insertion task were averaged for comparison, and are displayed by needle and tissue type in Figure 4. Experimentation shows that in all tissue and needle combinations, except the brachytherapy needle in porcine skin, the average error was below 0.065 N. The higher error of the brachytherapy needle in porcine skin is likely attributable to the much larger initial peak magnitude of force measured for the insertion, as can be seen in Figure 6. Similarly, the bovine liver, which saw the smallest insertion peak magnitudes, had the smallest average error for both needle types. FIGURE 2—NEEDLE INSERTION FORCE MEASUREMENT SETUP WITH BOVINE LIVER FIXTURE Needle Liver Fixture Load Cell Pressurized Top Plate Linear Actuator FIGURE 3—NEEDLES USED IN EXPERIMENTATION (LEFT) AND THEIR BEVELS (RIGHT) Conventional Hypodermic Brachytherapy Catheter Hypodermic The sample model outputs shown in Figures 5, 6, and 7 demonstrate the ability of the model to capture key differences between insertions in different tissues. For needles going through homogeneous tissue, the insertion force is continuous overall and is modeled in only one or two phases. However, for needles going through inhomogeneous tissue, the insertion force is highly discontinuous and is modeled in several phases. When the conventional hypodermic and brachytherapy needles were inserted into the phantom or the mannequin without fat, the tissue encountered was homogeneous. There was no initial force peak for these tissues due to the minimal force required to initially puncture the tissue. In these cases, the force rises in a near linear fashion as friction increases with insertion depth due to the additional contact area. When the brachytherapy and conventional hypodermic needles were inserted into the porcine skin, bovine liver, and mannequin with fat, the tissue encountered by the needle was inhomogeneous. This was also the case when the catheter hypodermic needle was inserted into the mannequin with and without fat, as without fat, the catheter needle was positioned such that it punctured the mannequin’s artificial artery. In these inhomogeneous tissue insertions, rapid, discontinuous transitions in the force were observed. For example, when a layer of excess fat was added to the mannequin, a transition point occurred when the needle exited the fat layer and entered the normal mannequin. This transition can clearly be seen with all three needles around an insertion depth between 15 and 20 mm. For the liver insertions, many peaks can be observed which correspond to the needle puncturing through the variety of internal structures within the organ, such as vasculature and connective tissue. In porcine skin insertion, a rapid build-up of force occurs as the needle strains the tissue prior to puncturing through, resulting in a rapid release of force. The model outputs also demonstrate the ability of the model to capture key differences in insertion force associated with different needle geometries. For example, the brachytherapy needle through porcine skin has a single rise and a single release of force. However, the conventional hypodermic needle through porcine skin has a single rise followed by two distinct releases. The conventional hypodermic has a longer bevel that results in the initial force release when the bevel first enters the tissue, then the second release once the entire bevel has pierced through the tissue. However, the brachytherapy needle bevel’s shorter length and duller tip require a greater strain in the tissue prior to 2030FIGURE 5—SAMPLE MODEL OUTPUTS FOR CONVENTIONAL HYPODERMIC NEEDLE Mannequin No Fat Mannequin With Fat Bovine Liver Porcine Skin Phantom Mannequin No Fat Mannequin With Fat Bovine Liver Porcine Skin Phantom Mannequin No Fat Mannequin With Fat FIGURE 7—SAMPLE MODEL OUTPUTS FOR CATHETER HYPODERMIC NEEDLE puncture. This results in a greater initial force build up that precedes only a single, rapid release of force. The difference between the insertions with these two needles is captured in the model by adding an additional piecewise phase for the conventional hypodermic needle and modifying parameters within phases to enable the greater peak force observed with the brachytherapy needle. Analysis of Error Error was plotted as a function of insertion depth for each trial, as shown in Figure 8, to gain insight into the model accuracy beyond the absolute mean error values. In phantom and mannequin insertions for the brachytherapy and conventional hypodermic needles, one of the largest contributions to model error occurred at the beginning of the insertion. In fact, in some cases, this even resulted in a small negative force to be initially predicted by the model. A likely cause for this error was that in the measured data, the insertion force rose initially in a very non-linear fashion due to initial deflection of tissue. As friction became the dominant force, the force rise took on a more linear form. There was no abrupt discontinuity between these behaviors, thus only one piecewise phase was assigned to them. This resulted in model error at the very beginning of the insertion where the force was briefly more non-linear. In future modeling, this could be addressed by assigning a separate phase to the initial non-linear portion, despite there being no abrupt discontinuity. In comparing the bovine liver error plot of Figure 8 with its corresponding model, it can be seen that major error spikes correspond to the large force peaks within the modeled data. The corresponding measured forces are shown in Figure 1B, where it can be visually observed that the model appears to predict the magnitude of these force peaks quite accurately. However, the position at which these peaks occur is shifted very slightly from the true position resulting in a brief significant error when the model is compared with the measured data. These miniscule shifts in position of the force peaks would likely have a negligible impact when it comes to using the model for haptic simulation. The acceptable level of error in the force model is a question of the fidelity required in the overall simulation system. There is still significant debate as to what level of fidelity is truly necessary to provide effective medical training, particularly considering the cost trade-offs associated with attempting to increase fidelity [28]. In this model, error can be further reduced by segmenting measured force data into much smaller sections. However, in doing so, the utility of the parameterization scheme is lost. The key advantage of this model is that it provides a simple framework for a variety of clinical scenarios to capture and manipulate the major haptic cues that occur along the axis of a needle as it progresses on a one dimensional insertion path. CONCLUSION AND FUTURE WORK A dynamic model has been presented for modeling axial needle insertion force as a function of insertion depth without many of the drawbacks associated with the complexity of other methods. By manipulating parameters, this model can be applied to a variety of insertion tasks and clinical scenarios. This adaptability has been demonstrated by using the model to replicate measured insertion forces for several needle and tissue type combinations. The future goal of this work is to implement this modeling scheme into a low cost, low fidelity simulation system that can be used in training multiple needle insertion procedures. Prior to doing so, the velocity dependence of model parameters must be studied and incorporated into the model to provide additional realism to simulations. In addition, experimental data will need to be obtained for true clinical insertion procedures in order to establish the proper parameter values. REFERENCES [1] McGee, D. C., and Gould, M. K., 2003, "Preventing Complications of Central Venous Catheterization," The New England Journal of Medicine, 348(12), pp. 1123-1133. [2] Eisen, L. A., Narasimhan, M., Berger, J. S., Mayo, P. H., Rosen, M. J., and Schneider, R. F., 2006, "Mechanical Complications of Central Venous Catheters," Journal of Intensive Care Medicine, 21(1), pp. 40-46. [3] Evans, L. V., Dodge, K. L., Shah, T. D., Kaplan, L. J., Siegel, M. D., Moore, C. L., Hamann, C. J., Lin, Z., and D'Onofrio, G., 2010, "Simulation Training in Central Venous Catheter Insertion: Improved Performance in Clinical Practice," Academic Medicine, 85(9), pp. 1462-1469. [4] Asadian, A., Kermani, M. R., and Patel, R. V., 2012, "A Novel Force Modeling Scheme for Needle Insertion Using Multiple Kalman Filters," IEEE Transactions on Instrumentation and Measurement, 61 (2), pp. 429-438. [5] Podder, T. K., Sherman, J., Messing, E. M., Rubens, D. J., Fuller, D., Strang, J. G., Brasacchio, R. A., and Yu, Y., 2006, "Needle Insertion Force Estimation Model using Procedure-Specific and Patient-specific Criteria," Proceedings of the 28th IEEE EMBS International Conference, IEEE, pp. 555-558. [6] Roth-Monzon, E.L., Chellali, A., Dumas, C., and Cao, C.G.L., 2011, "Haptic sensitivity in needle insertion: the effects of training and visual aid," Proceedings of the International Skills Conference, EDP Sciences, pp. 250-253. [7] Okamura, A. M., Simone, C., and O'Leary, M. D., 2004, "Force Modeling for Needle Insertion into Soft Tissue," IEEE Transactions on Biomedical Engineering, 51(10), pp. 1707-1716. [8] Goksel, O., Sapchuk, K., and Salcudean, S.E., 2011, "Haptic Simulator for Prostate Brachytherapy with Simulated Needle and Probe Interaction," IEEE Transactions on Haptics, 4(3), pp. 188-198. [9] DiMaio, S. P., and Salcudean, S. E., 2005, "Interactive Simulation of Needle Insertion Models," IEEE Transactions on Biomedical Engineering, 52(7), pp. 1167-1179. [10] Jin, X., Gao, D., and Lei, Y., 2014, "Interactive Simulation of Surgical Needle Insertion Into Soft Tissue," 2012, ASME 20125th Annual Dynamic Systems and Control Conference, ASME, pp. 457-464. [11] Chentanez, N., Alterovitz, R., Ritchie, D., Cho, L., Hauser, K. K., Goldberg, K., Shewchuk, J. R., and O'Brien, J. F., 2009, "Interactive Simulation of Surgical Needle Insertion and Steering," ACM Transactions on Graphics, 28(3), Article 88. [12] Lei, Y., and Lian, B., 2014, "Modeling and Simulation of Flexible Needle Insertion Into Soft Tissue Using Modified Local Constraint Method," Proceedings of the ASME 2014 International Manufacturing Science and Engineering Conference, ASME. [13] Yamaguchi, S., Tsutsui, K., Satake, K., Morikawa, S., Shirai, Y., and Tanaka, H. T., 2014, "Dynamic analysis of a needle insertion for soft materials: Arbitrary Lagrangian-Eulerian-based three-dimensional finite element analysis," Computers in Biology and Medicine, 53, pp. 42-47. [14] Oldfield, M., Dini, D., Giordano, G., and Rodriguez Y Baena, F., 2013, "Detailed finite element modelling of deep needle insertions into a soft tissue phantom using a cohesive approach," Computer Methods in Biomechanics and Biomedical Engineering, 16(5), pp. 530-543. [15] Misra, S., Ramesh, K. T., and Okamura, A. M., 2008, "Modeling of Tool-Tissue Interactions for Computer-Based Surgical Simulation: A Literature Review," Presence, 17(5), pp. 463-491. [16] Jin, X., Joldes, G. R., Wittek, A., and Miller, K., 2013, "3D Algorithm for Simulation of Soft Tissue Cutting," Computational Biomechanics for Medicine: Models, Algorithms and Implementation, pp. 49-62. [17] Kobayashi, Y., Onishi, A., Watanabe, H., Hoshi, T., Kawamura, K., Hashizume, M., and Fujie, M. G., 2010, "Development of an integrated needle insertion system with image guidance and deformation simulation," Computerized Medical Imaging and Graphics, 34(1), pp. 9-18. [18] Patriciu, A., 2012, "CUDA accelerated simulation of needle insertions in deformable tissue," Journal of Physics: Conference Series, 385(1). [19] Sedeh, R.S., Ahmadian, M. T., and Janabi-Sharifi, F., 2010, "Modeling, Simulation, and Optimal Initiation Planning for Needle Insertion Into the Liver," Journal of Biomechanical Engineering, 132(4). [20] Xu, J., Wang, L., Wong, K. C. L., and Shi, P., 2010, "A Meshless Framework For Bevel-tip Flexible Needle Insertion Through Soft Tissue," Proceedings of the 2010 3rd IEEE RAS & EMBS International Conference on Biomedical Robotics and Biomechatronics, IEEE, pp. 753-758. [21] Hoshi, T., Kobayashi, Y., and Fujie, M. G., 2009, "Method to Generate Distribution Maps of the Material Parameters of the Human Body Using Robotic and Dynamic Simulation Systems," IEEE/SICE International Symposium on System Integration, IEEE, pp. 60-66. [22] Kobayashi, Y., Okamoto, J., and Fujie, M. G., 2005, "Physical Properties of the Liver and the Development of an Intelligent Manipulator for Needle Insertion," Proceedings of the 2005 IEEE International Conference on Robotics and Automation, IEEE, pp. 32-39. [23] Elgezua, I., Song, S., Kobayashi, Y., and Fujie, M. G., 2013, "Event Classification in Percutaneous Treatments based on Needle Insertion Force Pattern Analysis," 2013 13th International Conference on Control, Automation, and Systems, ICROS, pp. 288-293. [24] Carra, A., and Avila-Vilchis, J. C., 2010, "Needle Insertion Modeling through Several Tissue Layers," 2010 2nd International Asia Conference on Informatics in Control, Automation and Robotics, IEEE, pp. 237-240. [25] Asadian, A., Patel, R. V., and Kermani, M. R., 2014, "Dynamics of Translational Friction in Needle-Tissue Interaction During Needle Insertion," Annals of Biomedical Engineering, 42(1), pp. 73-85. [26] Kobayashi, Y., Sato, T., and Fujie, M. G., 2009, "Modeling of Friction Force based on Relative Velocity between Liver Tissue and Needle for Needle Insertion Simulation Plates Needle," 31st Annual International Conference of the IEEE EMBS, IEEE, pp. 5274-5278. [27] Luboz, V., Zhang, Y., Johnson, S., Song, Y., Kilkenny, C., Hunt, C., Woolnough, H., Guediri, S., Zhai, J., Odetoyinbo, T., Littler, P., Fisher, A., Hughes, C., Chalmers, N., Kessel, D., Clough, P. J., Ward, J., Phillips, R., How, T., Bulpitt, A., John, N. W., Bello, F., and Gould, D., 2013, "ImaGiNe Seldinger: first simulator for Seldinger technique and angiography training," Computer Methods and Programs in Biomedicine, 111, pp. 419-434. [28] Manoharan, V., Gerwen, D. V., and Dankelman, J., 2012, "Design and Validation of an Epidural Needle Insertion Simulator with Haptic Feedback for Training Resident Anaesthesiologists," IEEE Haptics Symposium 2012, IEEE, pp. 341-348. [29] Xia, P., and Sourin, A., 2012, "Design and Implementation of a Haptics-based Virtual Venepuncture Simulation and Training System," VRCAI 2012, ACM, pp. 25-30. [30] Brett, P. N., Parker, T. J., Harrison, A. J., Thomas, T. A., and Carr, A., 1997, "Simulation of resistance forces acting on surgical needles," Journal of Engineering in Medicine, 211(4), pp. 335-347. [31] Barbe, L., Bayle, B., de Mathelin, M., and Gangi, A., 2007, "In Vivo Model Estimation and Haptic Characterization of Needle Insertions," The International Journal of Robotics Research, 26(11-12), pp. 1283-1301. [32] Narayanan, M.S., Zhou, X., Garimella, S., Waz, W., Mendel, F., and Krovi, V. N., 2012, "Data Driven Development of Haptic Models for Needle Biopsy Phantoms," 2012, ASME 20125th Annual Dynamic Systems and Control Conference, ASME, pp. 419-427. [33] Mastmeyer, A., Hecht, T., Fortmeier, D., and Handels, H., 2014, "Ray-casting based evaluation framework for haptic force feedback during percutaneous transhepatic catheter drainage punctures," International Journal of Computer Assisted Radiology and Surgery, 9(3), pp. 421-431. [34] F?rber, M., Hummel, F., Gerloff, C., and Handels, H., 2009, "Virtual Reality Simulator for the Training of Lumbar Punctures.," Methods of Information in Medicine, 48(5), pp. 493-501. [35] Crouch, J. R., Schneider, C. M., Wainer, J., and Okamura, A. M., 2005, "A Velocity-Dependent Model for Needle Insertion in Soft Tissue," Medical Image Computing and Computer-Assisted Intervention, pp. 624-632. [36] Dehghan, E., Wen, X., Zahiri-Azar, R., Marchal, M., and Salcudean, S. E., 2007, "Parameter Identification for a Needle-Tissue Interaction Model," Proceedings of the 29th Annual International Conference of the IEEE EMBS, IEEE, pp. 190-193. [37] van Gerwen, D. J., Dankelman, J., and van den Dobbelsteen, J. J., 2014, "Measurement and Stochastic Modeling of Kidney Puncture Forces," Annals of Biomedical Engineering, 42(3), pp. 685-695. [38] Moore, J. Z., and Shih, A. J., 2010, "Tissue Oblique Cutting Flow Angle and Needle Insertion Contact Length," Transactions of NAMRI / SME, 38, pp. 711-718. [39] Podder, T. K., Clark, D. P., Fuller, D., Sherman, J., Ng, W. S., Liao, L., Rubens, D. J., Strang, J. G., Messing, E. M., Zhang, Y. D., and Yu, Y., 2005, "Effects of Velocity Modulation During Surgical Needle Insertion.," Proceedings of the 2005 IEEE Engineering in Medicine and Biology 27th Annual Conference, IEEE, pp. 5766-5770. [40] Dimaio, S. P. and Salcudean, S. E., 2003, "Needle Insertion Modeling and Simulation," IEEE Transactions on Robotics and Automation, 19(5), pp. 864-875. 第四章 等效电路模型参数在线辨识 通过第三章函数拟合的方法可以确定钒电池等效电路模型中的参数,但是在实际运行过程中模型参数随着工作环境温度、充放电循环次数、SOC 等因素发生变化,根据离线试验数据计算得到的参数值估算电池SOC 可能会造成较大的估计误差。因此,在实际运行时,应对钒电池等效电路模型参数进行在线辨识,做出实时修正,提高基于模型估算SOC 的精度。 4.1 基于遗忘因子的最小二乘算法 参数辨识是根据被测系统的输入输出来,通过一定的算法,获得让模型输出值尽量接近系统实际输出值的模型参数估计值。根据能否实时辨识系统的模型参数,可以将常用的参数辨识方法分为离线和在线两类,离线辨识只能在数据采集完成后进行,不能对系统模型实时地在线调整参数,对于具有非线性特性的电池系统往往不能得到满意的辨识结果;在线辨识方法一般能够根据实时采集到的数据对系统模型进行辨识,在线调整系统模型参数。常用的辨识方法有最小二乘法、极大似然估计法和Kalman 滤波法等。因最小二乘法原理简明、收敛较快、容易理解和掌握、方便编程实现等特点,在进行电池模型参数辨识时采用了效果较好的含遗忘因子的递推最小二乘法。 4.1.1 批处理最小二乘法简介 假设被辨识的系统模型: 12121212()()()1n n n n b z b z b z y z G z u z a z a z a z ------+++==++++L L (4-1) 其相应的差分方程为: 1 1 ()()()n n i i i i y k a y k i b u k i ===--+-∑∑(4-2) 若考虑被辨识系统或观测信息中含有噪声,则被辨识模型式(4-2)可改写为: 1 1 ()()()()n n i i i i z k a y k i b u k i v k ===--+-+∑∑(4-3) 式中, ()z k 为系统输出量的第k 次观测值;()y k 为系统输出量的第k 次真值,()y k i -为系统输出量的第k i -次真值;()u k 为系统的第k 个输入值,()u k i -为 系统的第k i -个输入值;()v k 为均值为0的随机噪声。 浅析电力系统模型参数辨识 (贵哥提供) 一、现状分析 随着我国电力事业的迅猛发展, 超高压输电线路和大容量机组的相继投入, 对电力系统稳定计算、以及其安全性、经济性和电能质量提出了更高的要求。现代控制理论、计算机技术、现代应用数学等新理论、新方法在电力系统的应用,正在促使电力工业这一传统产业迅速走向高科技化。 我国大区域电网的互联使网络结构更复杂,对电力系统安全稳定分析提出了更高的要求,在线、实时、精确的辨识电力系统模型参数变得更加紧迫。由于电力系统模型的基础性、重要性,国外早在上世纪三十年代就开始了这方面的分析研究,[1,2]国内外的电力工作者在模型参数辨识方面做了大量的研究工作。[3]随后IEEE相继公布了有关四大参数的数学模型。1990年全国电网会议上的调查确定了模型参数的地位,促进了模型参数辨识的进一步发展,并提出了研究发电机、励磁、调速系统、负荷等元件的动态特性和理论模型,以及元件在极端运行环境下的动态特性和参数辨识的要求。但传统的测量手段,限制了在线实时辨识方法的实现。 同步相量测量技术的出现和WAMS系统的研究与应用,使实现在线实时的电力系统模型参数辨识成为可能。同步相量是以标准时间信号GPS作为同步的基准,通过对采样数据计算而得的相量。相量测量装置是进行同步相量测量和输出以及动态记录的装置。PMU的核心特征包括基于标准时钟信号的同步相量测量、失去标准时钟信号的授时能力、PMU与主站之间能够实时通信并遵循有关通信协议。 自1988年Virginia Tech研制出首个PMU装置以来,[4]PMU技术取得了长足发展,并在国内外得到了广泛应用。截至2006年底,在我国范围内,已有300多台P MU装置投入运行,并且可预计,在不久的将来PMU装置会遍布电力系统的各个主要电厂和变电站。这为基于PMU的各种应用提供了良好的条件。 二、系统辨识的概念 系统模型是实际系统本质的简化描述。[5]模型可分为物理模型和数学模型两大类。物理模型是根据相似原理构成的一种物理模拟,通过模型试验来研究系统的 基于最小二乘模型的Bayes 参数辨识方法 王晓侃1,冯冬青2 1 郑州大学电气工程学院,郑州(450001) 2 郑州大学信息控制研究所,郑州(450001) E-mail :wxkbbg@https://www.doczj.com/doc/031036307.html, 摘 要:从辨识定义出发,首先介绍了Bayes 基本原理及其两种常用的方法,接着重点介绍了基于最小二乘模型的Bayes 参数辨识,最后以实例用MATLAB 进行仿真,得出理想的辨识结果。 关键词:辨识定义;Bayes 基本原理;Bayes 参数辨识 中国图书分类号:TP273+.1 文献标识码:A 0 概述 系统辨识是建模的一种方法。不同的学科领域,对应着不同的数学模型,从某种意义上讲,不同学科的发展过程就是建立它的数学模型的过程。建立数学模型有两种方法:即解析法和系统辨识。L. A. Zadehll 于1962年曾对”辨识”给出定义[1]:系统辨识是在对输入和输出观测的基础上,在指定的一类系统中,确定一个与被识别的系统等价的系统。一般系统输出y(n)通常用系统过去输出y(n-m)和现在输入u(n)及过去输入u(n-m)的函数描述 y(n)=f(y(n-1),y(n-2),...,y(n-m y ), u(n),u(n-1),... ,u(n-m u ))=f(x(n),n) x(n)=[y(n-1),y(n-2),...y(n-m y ), u(n),u(n-1),...,u(n-m u )]’ 这里f(,)为未知函数关系,一般情况为泛函数,可以是线性函数或非线性函数,分别对应于线性或非线性系统,通常这个函数未知,但是局部输入输出数据可以测出,系统辨识的任务就是根据这部分信息寻找确定函数或确定系统来逼近这个未知函数。但实际上我们不可能找到一个与实际系统完全等价的模型。从实用的角度来看,系统辨识就是从一组模型中选择一个模型,按照某种准则,使之能最好地拟合由系统的输入输出观测数据体现出的实际系统的动态或静态特性。接下来本文就以最小二乘法为基础的Bayes 辨识方法为例进行分析介绍并加以仿真[4]。 1 Bayes 基本原理 Bayes 辨识方法的基本思想是把所要估计的参数看做随机变量,然后设法通过观测与该参数有关联的其他变量,以此来推断这个参数。 设μ是描述某一动态系统的模型,θ是模型μ的参数,它会反映在该动态系统的输入输出观测值中。如果系统的输出变量z(k)在参数θ及其历史纪录(1) k D ?条件下的概率密度函 数是已知的,记作p(z(k)|θ,(1) k D ?),其中(1) k D ?表示(k-1)时刻以前的输入输出数据集 合,那么根据Bayes 的观点参数θ的估计问题可以看成是把参数θ当作具有某种先验概率密 度p (θ,(1) k D ?)的随机变量,如果输入u(k)是确定的变量,则利用Bayes 公式,把参数θ 的后验概率密度函数表示成[2] p (θ,k D )= p (θ|z (k ),u(k ), (1) k D ?)=p (θ|z (k ),(1) k D ?) = (k-1) (k-1) p(z(k)/,D )p(/D ) (k-1)(k-1)p(z(k)/,D )p(/D )d θθθθθ∞∫?∞ (1) 在式(1)中,参数θ的先验概率密度函数p(θ|(1) k D ?)及数据的条件概率密度函数p(z(k)|θ, ISSN 1000-0054CN 11-2223/N 清华大学学报(自然科学版)J T singh ua Un iv (Sci &Tech ),1999年第39卷第3期 1999,V o l.39,N o.311/34 37~40 负荷建模和参数辨识的遗传进化算法* 朱守真, 沈善德, 郑宇辉, 李 力, 艾 芊, 曲祖义 清华大学电机工程与应用电子技术系,北京100084; 东北电力集团公司,沈阳110006 收稿日期:1998-06-23 第一作者:女,1950年生,副教授 *基金项目:国家攀登计划B(85-35) 文 摘 提出了一种用于电力系统负荷建模和参数辨识的遗传进化算法,该方法与传统的最小二乘法相比具有全局搜索优化特点,适用于非线性、不连续或微分不连续的各种负荷模型。该方法已成功用于工业负荷实测数据辨识及动态和静态负荷建模。在静态负荷建模上,辨识结果略优于传统的最小二乘法,且通用性更好,只需做极小的修改就可以用于各种形式的静态负荷模型。在动态负荷建模上算法不仅给出了更优秀的结果,而且表现出很好的稳健性。结果表明此方法在负荷建模中的优势。 关键词 遗传进化算法;负荷建模;参数辨识分类号 T M 761 电力负荷模型是电力系统分析、规划、运行和计算的基础,尤其在计算中对电力系统动态行为的模拟结果影响很大。不同的计算需要采用不同的负荷模型,常规采用以不同比例的恒定阻抗、恒定电流、恒定功率或考虑不同动静比例负荷模型的方式使计算结果相差很大,甚至会导致完全错误的结论[1,2]。研究表明建立符合实际的负荷模型是十分必要的。负荷特性具有时变、非线形、不确定等多种特点,且实际负荷的用电设备构成差别很大,尤其是当电压或电流变化时,负荷产生突变,这也增加了建模的难度和复杂性。参数辨识是负荷建模的核心,目前常用的有最小二乘法、辅助变量法、分段线性多项式等方法,其中传统的方法不能有效地克服负荷建模中的非线性和不连续性等问题,会产生多值性等误差。近年来ANN 方法在建模方面已取得成功,但该方法更侧重于模拟模型的动态过程,且形成的结果是非参数模型。 遗传进化算法是模拟自然界进化中优胜劣汰的 优化过程,原则上能以较大的概率找到全局的最优解,具有并行、通用、鲁棒性强,全局收敛性好等优 点。研究人员已在发电规划[3],发电调度[4],无功优化[5]中用算例证明了EP 方法比传统的梯度寻优技术更优越。 本文采用遗传进化算法对静态、动态负荷进行了实测建模。 1 电力负荷的数学模型 本文主要描述以负荷特性来分类的静态和动态模型的建模方法。1.1 静态负荷模型 静态负荷模型表示某一时刻负荷所吸收的有功功率和无功功率与同一时刻负荷母线电压和频率之间的函数关系。静态负荷模型一般以幂函数和多项式模型表示。 本文以幂函数模型为例进行计算,幂函数表示的静态负荷特性如下: P =P 0U a 1f a 2, Q =Q 0 U b 1 f b 2 . (1) 定义误差函数 E w = N i =1 [W m (i )-W c (i )] 2 N (2)式中:N 为测量点数,W m (i )分别表示第i 次有功或无功功率测量值,W c (i )表示利用第i 次采样U i ,f i 的值由式(1)得到的有功或无功计算值,X p 、X q 是待辨识参数的向量: X p =[P 0,a 1,a 2], X q =[Q 0,b 1,b 2]. (3) 辨识问题表述为极小值寻优问题,即搜索一组参数使误差E w 达到最小值。1.2 动态负荷的模型 动态负荷模型表示某一时刻负荷所吸收的有功 机器人动力学研究的典型方法和应用 (燕山大学 机械工程学院) 摘 要:本文介绍了动力学分析的基础知识,总结了机器人动力学分析过程中比较常用的动力学分析的方法:牛顿—欧拉法、拉格朗日法、凯恩法、虚功原理法、微分几何原理法、旋量对偶数法、高斯方法等,并且介绍了各个方法的特点。并通过对PTl300型码垛机器人弹簧平衡机构动力学方法研究,详细分析了各个研究方法的优越性和方法的选择。 前 言:机器人动力学的目的是多方面的。机器人动力学主要是研究机器人机构的动力学。机器人机构包括机械结构和驱动装置,它是机器人的本体,也是机器人实现各种功能运动和操作任务的执行机构,同时也是机器人系统中被控制的对象。目前用计算机辅助方法建立和求解机器人机构的动力学模型是研究机器人动力学的主要方法。动力学研究的主要途径是建立和求解机器人的动力学模型。所谓动力学模指的是一组动力学方程(运动微分方程),把这样的模型作为研究力学和模拟运动的有效工具。 报告正文: (1)机器人动力学研究的方法 1)牛顿—欧拉法 应用牛顿—欧拉法来建立机器人机构的动力学方程,是指对质心的运动和转动分别用牛顿方程和欧拉方程。把机器人每个连杆(或称构件)看做一个刚体。如果已知连杆的表征质量分布和质心位置的惯量张量,那么,为了使连杆运动,必须使其加速或减速,这时所需的力和力矩是期望加速度和连杆质量及其分布的函数。牛顿—欧拉方程就表明力、力矩、惯性和加速度之间的相互关系。 若刚体的质量为m ,为使质心得到加速度a 所必须的作用在质心的力为F ,则按牛顿方程有:ma F = 为使刚体得到角速度ω、角加速度εω= 的转动,必须在刚体上作用一力矩M , 则按欧拉方程有:εωI I M += 式中,F 、a 、M 、ω、ε都是三维矢量;I 为刚体相对于原点通过质心并与刚 上海交通大学 硕士学位论文 Bouc-Wen滞回模型的参数辨识及其在电梯振动建模中的应用 姓名:周传勇 申请学位级别:硕士 专业:机械设计及理论 指导教师:李鸿光 20080201 Bouc-Wen滞回模型的参数辨识 及其在电梯振动建模中的应用 摘 要 电梯导靴是连接轿箱系统与导轨的装置,它能起到导向和隔振减振的作用。同时,在电梯的运行过程中它又将导轨由于制造或安装所造成的表面不平顺度传递给轿箱系统,从而引起轿箱系统的水平振动。国内外学者在电梯水平振动的建模和分析中,往往把导靴视为线性弹簧-阻尼元件来建模而忽略了非线性因素。事实上导靴与导轨之间存在非线性的迟滞摩擦力,本文通过实验的方法,采用Bouc-Wen 滞回模型来建立导靴-导轨非线性摩擦力模型。 Bouc-Wen滞回模型因其微分形式的非线性表达式而使得其参数辨识存在较大的困难,本文利用模型中部分参数的不敏感性,通过数学变换将非线性参数辨识问题转化为线性参数辨识问题,从而使得问题大大简化,参数辨识的效果也能满足要求。 基于以上导靴-导轨间摩擦力模型,本文进而建立了轿箱-导轨耦合水平振动动力学模型,该模型将轿箱系统等效为2自由度的平面运动刚体,将导靴等效为质量-弹簧-阻尼单元,同时考虑了导靴-导轨间的非线性摩擦力,以及导靴靴衬与导轨间接触的不连续性等。 在建立了轿箱-导轨耦合水平振动动力学模型后,利用Matlab/Simulink,建立了相应的仿真模型,开展了几种典型导轨不 平顺度激励(弯曲、失调和台阶)下的仿真分析。研究结果表明,这些分析对于电梯结构优化设计和动力学建模与分析有理论指导意义。 关键词:迟滞,参数辨识,非线性,动力学建模,系统仿真 参数辨识 参数辨识的步骤 飞行器气动参数辨识是一个系统工程,包括四部分:①试验设计,使试验能为辨识提供含有足够信息量且信息分布均匀的试验数据;②气动模型结果确定,即从候选模型集中,根据一定的准则和经验,选出最优的气动模型构式;③气动参数辨识,根据辨识准则和数据求取模型中待定参数,这是气动辨识定量研究的核心阶段;④模型检验,确认所得气动模型是否确实反映了飞行器动力学系统中气动力的本质属性。这四个部分环环相扣,缺一不可,要反复进行,直到对所得气动模型满意为止。 参数辨识的方法 参数辨识方法主要有最小二乘算法、极大似然法、集员辨识法、贝叶斯法、岭估计法、超椭球法和鲁棒辨识法等多种辨识方法。虽然目前参数辨识的领域己经发展了多种算法,但是用于气动参数估计的算法主要有:极大似然法(ML),广义Kalman滤波(EKF)法,模型估计法(EBM )、分割及多分割算法(PIA及MPIA)、最小二乘法,微分动态规划法等。 因为最小二乘法和极大似然法是两种经典的算法,目前己经发展得相当成熟。最小二乘法适于线性模型的参数辨识,可以用于飞行器系统辨识中很多的线性模型,如惯性仪表误差系数的辨识,线性时变离散系统初始状态的辨识及多项式曲线拟合等。目前最小二乘法已经广泛应用于工程实际中。而极大似然算法因其具有渐进一致性、估计的无偏性、良好的收敛特性等特点而被广泛应用于飞行器参数辨识领域。 最小二乘法大约是1975年高斯在其著名的星体运动轨道预报研究工作中提出来的。后来,最小二乘法就成了估计理论的奠基石。由于最小二乘法原理简单,编程容易,所以它颇受人们重视,应用相当广泛。 极大似然估计算法在实践中不断地被加以改进,这种改进主要表现在三个方 基于最小二乘法的系统参数辨识 研究生二队李英杰 082068 摘要:系统辨识是自动控制学科的一个重要分支,由于其特殊作用,已经广泛应用于各种领域,尤其是复杂系统或参数不容易确定的系统的建模。过去,系统辨识主要用于线性系统的建模,经过多年的研究,已经形成成熟的理论。但随着社会、科学的发展,非线性系统越来越受到人们的关注,其控制与模型之间的矛盾越来越明显,因而非线性系统的辨识问题也越来越受到重视,其辨识理论不断发展和完善本。文重点介绍了系统参数辨识中最小二乘法的基本原理,并通过热敏电阻阻值温度关系模型的辨识实例,具体说明了基于最小二乘法参数辨识在Matlab中的实现方法。结果表明基于最小二乘法具有算法简单、精度较高等优点。 1. 引言 所谓辨识就是通过测取研究对象在人为输入作用下的输出响应,或正常运行时的输入输出数据记录,加以必要的数据处理和数学计算,估计出对象的数学模型。这是因为对象的动态特性被认为必然表现在它的变化着的输入输出数据之中,辨识只不过是利用数学的方法从数据序列中提炼出对象的数学模型而已[1]。最小二乘法是系统参数辨识中最基本最常用的方法。最小二乘法因其算法简单、理论成熟和通用性强而广泛应用于系统参数辨识中。本文基于热敏电阻阻值与温度关系数据,介绍了最小二乘法的参数辨识在Matlab中的实现。 2. 系统辨识 一般而言,建立系统的数学模型有两种方法:激励分析法和系统辨识法。前者是按照系统所遵循的物化(或社会、经济等)规律分析推导出模型。后者则是从实际系统运行和实验数据处理获得模型。如图1 所示,系统辨识就是从系统的输入输出数据测算系统数学模型的理论和方法。更进一步的定义是L.A.Zadeh 曾经与1962 年给出的,即“系统辨识是在输入和输出的基础上,从系统的一类系统范围内,确立一个与所实验系统等价的系统”。另外,系统辨识还应该具有3 个基本要素,即模型类、数据和准则[5]。被辨识系统模型根据模型形式可分为参数模型和非参数模型两大类。所谓参数模型是指微分方程、差分方程、状态方程等形式的数学模型;而非参数模型是指频率响应、脉冲响应、传递函数等隐含参数的数学模型。在辨识工程中,模型的确定主要根据经验对实际对象的特性进行一定程度上的假设,如对象的模型是线性的还是非线性的、是参数模型还是非参数模型等。在模型确定之后,就可以根据对象的输入输出数据,按照一定的辨识算法确定模型的参数[4]。 图1 被研究的动态系统 3. 最小二乘法(LS)参数估计方法 对于参数模型辨识结构,系统辨识的任务是参数估计,即利用输入输出数据估计这些参数,建立系统的数学模型。在参数估计中最常用的是最小二乘法(LS)、 文章编号:1006-1576(2008)11-0079-04 基于动力学模型的轮式移动机器人运动控制 张洪宇,张鹏程,刘春明,宋金泽 (国防科技大学机电工程与自动化学院,湖南长沙 410073) 摘要:目前,对不确定非完整动力学系统进行设计的主要方法有自适应控制、预测控制、最优控制、智能控制等。结合WMR动力学建模理论的研究成果,对基于动力学模型的WMR运动控制器的设计和研究进展进行综述,并分析今后的重点研究方向。 关键词:轮式移动机器人;动力学模型;运动控制;非完整系统 中图分类号:TP242.6; TP273 文献标识码:A Move Control of Wheeled Mobile Robot Based on Dynamic Model ZHANG Hong-yu, ZHANG Peng-cheng, LIU Chun-ming, SONG Jin-ze (College of Electromechanical Engineering & Automation, National University of Defense Technology, Changsha 410073, China) Abstract: At present, methods of non-integrity dynamic systems design mainly include adaptive control, predictive control, optimal control, intelligence control and so on. Based on analyzing the recent results in modeling of WMR dynamics, a survey on motion control of WMR based on dynamic models was given. In addition, future research directions on related topics were also discussed. Keywords: Wheeled mobile robot; Dynamic model; Motion control; Non-integrity system 0 引言 随着生产的发展和科学技术的进步,移动机器人系统在工业、建筑、交通等实际领域具有越来越广泛的应用和需求。进入21世纪,随着移动机器人应用需求的扩大,其应用领域已从结构化的室内环境扩展到海洋、空间和极地、火山等环境。较之固定式机械手,移动机器人具有更广阔的运动空间,更强的灵活性。移动机器人的研究必须解决一系列问题,包括环境感知与建模、实时定位、路径规划、运动控制等,而其中运动控制又是移动机器人系统研究中的关键问题。故结合WMR动力学建模理论的研究成果,对基于动力学模型的WMR运动控制器设计理论和方法的研究进展进行研究。 1 WMR动力学建模 有关WMR早期的研究文献通常针对WMR的运动学模型。但对于高性能的WMR运动控制器设计,仅考虑运动学模型是不够的。文献[1]提出了带有动力小脚轮冗余驱动的移动机器人动力学建模方法,以及WMR接触稳定性问题和稳定接触条件。文献[2]提出一种新的WMR运动学建模的方法,这种方法是基于不平的地面,从每个轮子的雅可比矩阵中推出一个简洁的方程,在这新的方程中给出了车结构参数的物理概念,这样更容易写出从车到接触点的转换方程。文献[3]介绍了与机器人动作相关的每个轮子的雅可比矩阵,与旋转运动的等式合并得出每个轮子的运动方程。文献[4]基于LuGre干摩擦模型和轮胎动力学提出一种三维动力学轮胎/道路摩擦模型,不但考虑了轮胎的径向运动,同时也考虑了扰动和阻尼摩擦下动力学模型,模型不但可以应用在轮胎/道路情况下,也可应用在对车体控制中。在样例中校准模型参数和证实了模型,并用于广泛应用的“magic formula”中,这样更容易估计摩擦力。在文献[5]中同时考虑运动学和动力学约束,其中提出新的计算轮胎横向力方法,并证实了这种轮胎估计的方法比线性化的轮胎模型好,用非线性模型来模拟汽车和受力计算,建立差动驱动移动机器人模型,模型本身可以当作运动控制器。 2 WMR运动控制器设计的主要发展趋势 在WMR控制器设计中,文献[6]给出了全面的分析,WMR的反馈控制根据控制目标的不同,可以大致分为3类:轨迹跟踪(Trajectory tracking)、路径跟随(Path following)、点镇定(Point stabilization)。轨迹跟踪问题指在惯性坐标系中,机器人从给定的初始状态出发,到达并跟随给定的参考轨迹。路径跟随问题是指在惯性坐标系中,机器人从给定的初始状态出发,到达并跟随指定的几何 收稿日期:2008-05-19;修回日期:2008-07-16 作者简介:张洪宇(1978-)男,国防科学技术大学在读硕士生,从事模式识别与智能系统研究。 , 模态参数辨识方法综述 摘要:本文对模态分析和模态参数识别进行了综述,对当前识别方法的原理、识别精度及适用条件进行阐述和比较,提出环境激励下模态参数识别方法需解决的关键问题及模态分析在缺陷检测和结构优化中作用。 关键词:模态分析模态参数识别模态分析与缺陷检测结构工作模态 0引言 模态分析是将线性时不变系统振动微分方程组中的物理坐标变换为模态坐标,使方程组解耦,成为一组以模态坐标及模态参数描述的独立方程,坐标变换的变换矩阵为振型矩阵,其每列即为各阶振型。模态是机械结构的固有振动特性,每一个模态具有特定的固有频率、阻尼比和模态振型。这些模态参数可以由计算或试验分析取得,这样一个计算或试验分析过程称为模态分析。振动模态是弹性结构固有的、整体的特性。如果通过模态分析方法搞清楚了结构物在某一易受影响的频率范围内,各阶主要模态的特性,就可能预知结构在此频段内,在外部或内部各种振源作用下实际振动响应,而且一旦通过模态分析知道模态参数并给予验证,就可以把这些参数用于(重)设计过程,优化系统动态特性,或者研究把该结构连接到其他结构上时所产生的影响。模态分析的最终目标是识别出系统的模态参数,为结构系统的振动分析、振动故障诊断和预报、结构动力特性的优化设计提供依据。 解析模态分析可用有限元计算实现,而实验模态分析则是对结构进行可测可控的动力学激励,由激振力和响应的信号求得系统的频响函数矩阵,再在频域或转到时域采用多种识别方法求出模态参数,得到结构固有的动态特性,这些特性包括固有频率、振型和阻尼比等。有限元法是当前分析机械结构模态的主要方法,很多学者研究了单裂缝和多裂缝缺陷对不同结构动态特性的影响,但这些研究仅局限于出现缺陷结构的当前状态,考虑到缺陷在机械结构使用过程中的扩展,提出了模态分析与缺陷扩展理论相结合的方法分析缺陷的发展趋势,便于机械结构剩余寿命的评估,使已达到设计寿命的结构在失效前仍然发挥其功能,节约了经济成本。 一般模态识别方法是基于实验室条件下的频率响应函数进行的参数识别方法,它要求同时测得结构上的激励和响应信号。但是,在许多工程实际应用中,工作条件和实验室条件相差很大,对一些大型结构无法施加激励或施加激励费用很昂贵,因此要求识别结构在工作条件下的模态参数。工作模态参数识别方法与传统模态参数识别方法相比有如下特点:一、仅 Bouc-Wen模型因数字处理方便简单而得到较为广泛的应用,力可以表示为: 利用遗传算法工具箱(GA)对Bouc-Wen模型进行参数识别。 实验数据来源于对磁流变阻尼器(MR damper)进行性能测试,试验获得的数据包括力F,位移x,采用频率已知,速度和加速度可以由位移求导得出。 参数识别出现程序如下:(文件名:Copy_0_of_BoucWen) function j=myfung(x) y0=[0]; yy=y0; tspan=[]'; s=[]'; v=[]'; Ft=[]'; rr=max(size(s));%计算数据个数 i=1; while (i等效电路模型参数在线辨识
浅析电力系统模型参数辨识
基于最小二乘模型的Bayes参数辨识方法
负荷建模和参数辨识的遗传进化算法
机器人动力学汇总
Bouc-Wen 滞回模型的参数辨识
参数辨识示例 报告
基于最小二乘法的系统参数辨识
基于动力学模型的轮式移动机器人运动控制_张洪宇
模态参数辨识方法——综述
遗传算法工具箱识别(GA)Bouc-Wen模型参数辨识_识别
相关主题
文本预览